Mamoru Mimura1, Koji Yamamoto2
1Dept. Urban Management, Graduate School of Engineering, Kyoto University, Kyoto, Japan
2Geo-Informatics Engineering Group, Geo-Research Institute, Osaka, Japan
Correspondence to: Mamoru Mimura, Dept. Urban Management, Graduate School of Engineering, Kyoto University, Kyoto, Japan.
| Email: |  |
Copyright © 2014 Scientific & Academic Publishing. All Rights Reserved.
Abstract
Various databases for underground information have been developed in Japan. They have been independently developed and used for regional geotechnical research, construction management, evaluation for geo-hazard and geo-environmental assessment. The present status of geoinformatic databases in Japan is briefly explained followed by the several examples for application of them. Kansai geoinformatic database is selected to explain the utilization for description of subsoil structures. Discussion is extended to assessment for liquefaction potential that become the fundamental information for the regional action planning of disaster mitigation. The sophisticated procedure for integration and interconnection of the individual databases is also discussed by proposing the concept of “Representative Soil Profile Model” that is the mesh subsoil model for 250m square block. This mesh modeling is now conducted in the main large cities in Japan to establish the seamless national subsoil model to be utilized for the nationwide disaster mitigation planning.
Keywords:
Geotechnical Database, Boring Data, Geo-informatics, Liquefaction Potential, Geo-hazard
Cite this paper: Mamoru Mimura, Koji Yamamoto, Development of Geoinformatic Database and Its Utilization to Engineering Practice, Journal of Civil Engineering Research, Vol. 4 No. 3A, 2014, pp. 1-13. doi: 10.5923/c.jce.201402.01.
1. Introduction
In the past several decades, huge amount of subsurface information has been accumulated in urban, suburban and rural areas in many countries for various purposes such as disaster mitigation, infrastructure development, urban development, and construction of high-rise buildings. Tremendous cost, energy and time have been spent for collecting the subsurface information. They are presented in various forms such as, for example, borehole logs, soil cross sections, soil test data sheets, geotechnical investigation reports, topographic maps, geological maps, and underground structure details. Presently they are scattered at various organizations (public and private) and stored in various ways (organized and disorganized). Some of the information may be buried under accumulated soil reports, or may be discarded periodically or at whatever time. Being aware of huge amount of accumulated geotechnical information and the scatter and loss of valuable information that our predecessor collected in the past several decades, we, geotechnical engineers, as one would expect, think that such geotechnical information should be systematically collected, stored, and maintained and should be utilized effectively. Our world still has lots of problems to tackle as listed below for example, and money should not be wasted for repeating the same work.- Disaster mitigation: Earthquakes, volcano eruptions, local down pours- Problems particular to urban areas: Ground subsidence, flooding of underground space, slope collapses, heat island phenomena, contamination of soil and groundwater- Infrastructure development and maintenanceDifficulties to handle past and old subsurface data actually existed because of;- Data stored in analog form (paper)- Insufficient computer processing ability to handle huge volume of data- Lack of data storage technology- Lack of application technology The above difficulties, however, have gradually been removed due to advance of information technology, including computer hardware, digitizing technology, communication technology, data storage technology, and graphic technology. Figure 1 shows the present status of geoinformatic databases regionally developed in Japan [1]. The individual databases have independently been developed with different procedures. It is true some of them are systematically constructed and operated, but many of them still remain as private and personal ones without opening to public. As is already stated above, geoinformatic databases have well been utilized for various purposes. However difference in the procedure of development and the structure of databases prevent the individual databases from linking, integrating one after another. Furthermore, the difference in the quality of these databases causes the uneven analyzed outputs based on them. 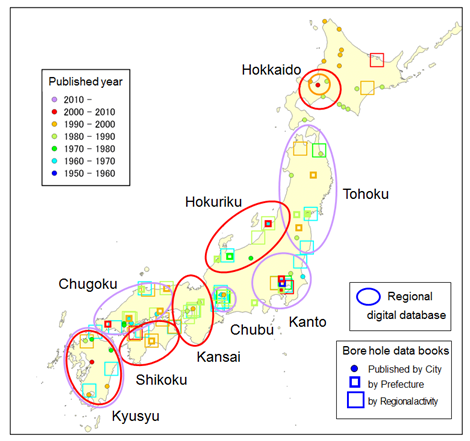 | Figure 1. Location of the developed Geoinformatic Databases in Japan [1] |
In the present paper, importance and significance of the development of geoinformatics databases are discussed particularly for the assessment of earthquake induced geo-hazard. It should be recognized that the modelling of subsoil structure seriously influences the evaluating ground motion. Liquefaction is also one of the most serious geotechnical problems of public concern. Geoinformatic database play a significant role to evaluate the possible occurrence of liquefaction. Examples of the latest achievement of liquefaction assessment in Japan are explained.
2. Development of Geoinformatic Database
Procedures to develop geoinformatics databases are not unique but full of variety [2]. They are strongly prescribed by local characteristics of geology as well as the status of development of the basic boring data. It means that the common procedures adopted without exception do not exist. The procedure to develop a geoinformatics database is hence explained by exemplifying the pioneer action in the Kansai area, Japan.
2.1. General Description of Geo-informatics Database in Kansai
The Kansai Geo-informatics Database (GIbase) is comprised of more than 38,000 borehole data of geotechnical investigation and has been developed by cooperation among industrial-government-academic organizations in Kansai region over the past two decades [3]. Figure 2 shows the historical developments of GIbase. As already stated above, many large cities such as Osaka and Kobe have been developed on the Osaka Plains and adjacent coastal area along Osaka Bay where soft grounds are widely spread. Then, the development of these coastal areas required careful site investigations with a large number of borehole data. Extensive investigations of the Osaka Bay seabed were necessary for the waterfront development, such as Kansai International Airport and Phoenix Project of landfill for waste disposals. The Research Committee on Seabed Deposit of Osaka Bay (1984 – 1991) was established by the Kansai Branch of Japanese Geotechnical Society. Then, it was succeeded to the Research Council of Geotechnical Information on Osaka Bay. Based on the research activities under this council “Geotechnical Information Databases in Osaka Bay area” was constructed as the marine database. On the other hand, the Research Committee on Utilizing of Underground Space was established in 1989, mainly for dealing with development of public infrastructures by utilizing deep underground spaces in Osaka, Kobe and Kyoto. It was succeeded to the Geo-Database Information Committee on Kansai. The research activities under this committee have produced “Geotechnical Information Database in Kansai Inland”. These two databases were integrated into a single system in 2003, controlled by the Council of Kansai Geo-informatics and then the council has reorganized to form the Kansai Geo-informatics Network (KG-NET). 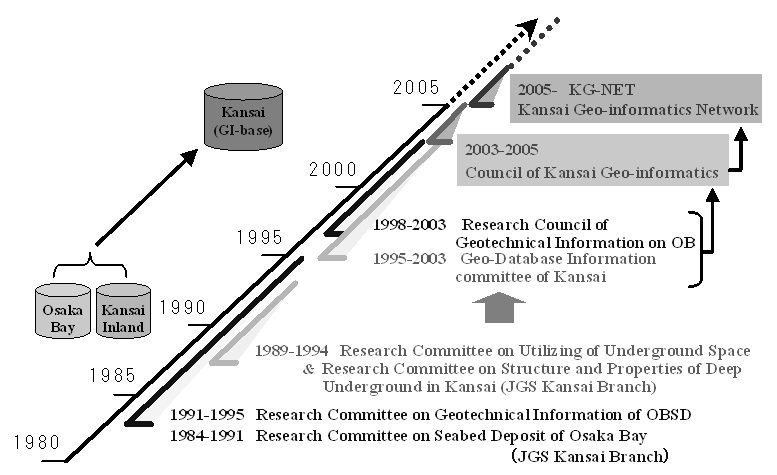 | Figure 2. History of development of GIbase |
2.2. System and Input Data for Database
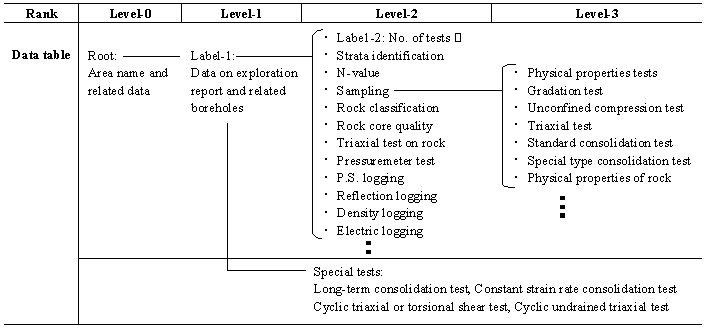
Kansai Geo-informatics Database (GIbase) was constructed by using Database for Information of Ground (DIG) system that was originally developed by Geo-Research Institute [4], [5]. The system used for DIG was constructed with a core management system assembling the boring data with its inherent format by extending the concept of relational database. It is composed of the following four functions: (1) Function of total control (Host DB)(2) Function of data input control (local DB)(3) Function of data extraction and processing (AP)(4) Function of data addition (Layer DB)The main operation system is controlled by UNIX whereas the local DB is controlled by WINDOWS. For personal use, the WINDOWS version is provided for data extraction and processing (AP). By utilizing these functions, GDS stores the borehole investigation data of strata identification, SPT N-value, gradation test result etc. These data are utilized for prediction of liquefaction in sandy deposits during earthquake. Table 1 shows the input data and data structure of DIG. In addition to GDS, the information related to active faults and micro-topography is also stored by Geographical Information System (GIS). The necessary handling functions to control the Geo-informatics database, DIG consists of five components, such as reference, extraction, processing, analysis and display. The fundamental functions of DIG are as follows: (1) Indicating the location of each boring on the map and selecting the optional ones using mouse operation(2) Referring the boring on optional condition(3) Creating cross-sectional view of the ground by processing the selected borings (4) Creating a summary table for soil properties and experimental results (5) Processing experimental data and display the distribution chart, correlation chart etc.In addition to such basic functions, DIG also interfaces with application program for the extraction of regional ground characteristics or the examination results of earthquake disaster such as liquefaction potential. The assessment of liquefaction introduced in the present paper, is effectively conducted by using the function of AP. DIG also has a special function that examines the quality of data by checking the treated data and getting rid of unsuitable ones for the purpose of forming data group. It is of importance for Geo-informatics database to be in high quality with reliability. Table 1. Input data and data structure of DIG
 |
| |
|
3. Investigation of Subsoil Condition Based on GIbase
Assessment for earthquake-induced geo-disasters strongly requires the subsoil condition together with the physical and mechanical properties. In the sense, the sophisticated database is indispensable to provide enough information on demand. In the following section, the relevant examples of the performance by GIbase for Osaka Plain and Kyoto Basin are introduced.
3.1. Osaka Plain
A representative cross-sectional view of subsurface ground for Osaka Plain is shown in Figure 3 based on the Kansai Geoinformatic Database [6]. The selected line is the east-west one including the center of Osaka City along the north of Osaka Castle. Uemachi Upland is located in the heart of Osaka where all strata are tilting by the prevalence of folded structure developed by the tectonic movement of the Uemachi Fault. Geological interpretation provides the identification of the individual subsoil layers, such as Ma and Dg as shown in Figure 3. Here, Ma and Dg denote “marine clay” and “Pleistocene sand gravel” respectively. On the west side of Osaka, the thick Holocene marine clay (Ma 13) layer exists underlain by the Pleistocene gravel layer (Dg 1) and the alternating Pleistocene deposits. The strata are rather stable and horizontally even. On the eastern part of Osaka, the basin structure can be seen between the Uemachi Upland and the Ikoma Mountains. The Holocene clay in this region is well-known as sensitive clay. At the Uemachi Upland, the old layers heaved by the tectonic movement and appear near the surface of the ground. 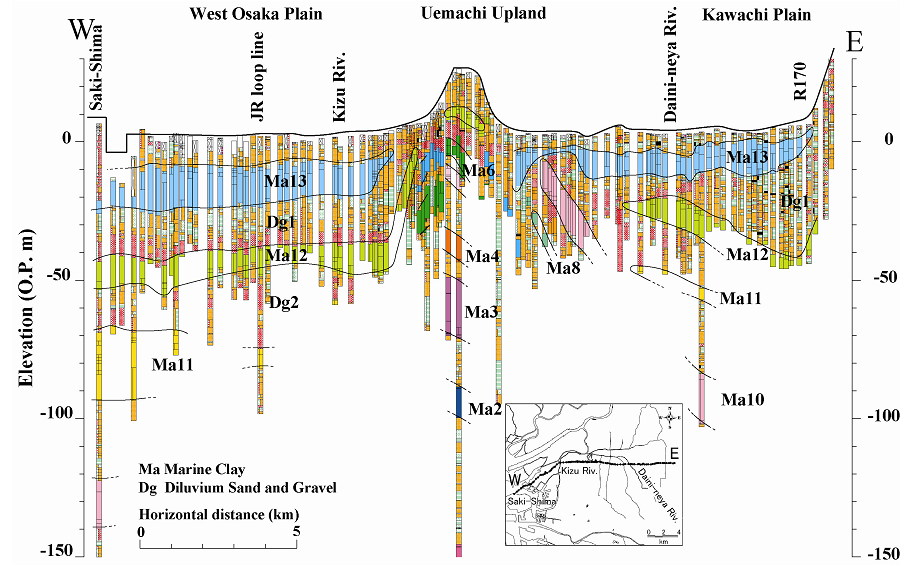 | Figure 3. Example of the cross-sectional east-west view of subsurface ground in Osaka Plain |
3.2. Kyoto Basin
A representative cross-sectional view of subsurface ground for Kyoto Basin is shown in Figure 4 drawn by the Geo-database [7]. The selected line crosses the center of Kyoto Basin from north to south. On the basis of the geological characteristics, the area can be divided into 4 regions. The elevation of the ground at the north end (north of Kyoto City) of this line exceeds 100m and continuously declines to the south. The ground surface becomes almost flat at the Keihan Railway in region C. The difference in elevation is almost 90m between the north of Kyoto City and the Keihan Railway in a distance of about 17km. Compared to region I, the surface of region III and IV is flat with an elevation O.P. +10m to +20m. As is easily known, the subsoil of Kyoto Basin consists mainly of gravels in the northern part (region A and B) while soft fine soils such as silt and sand can be seen at the shallow part in the southern part (region C and D). Pleistocene marine clay (Ma 9) appears at the elevation of –40m to –50m. This clay was found from the deep borings, KD-1 and KD-2 and confirmed as marine clay by pollen analysis.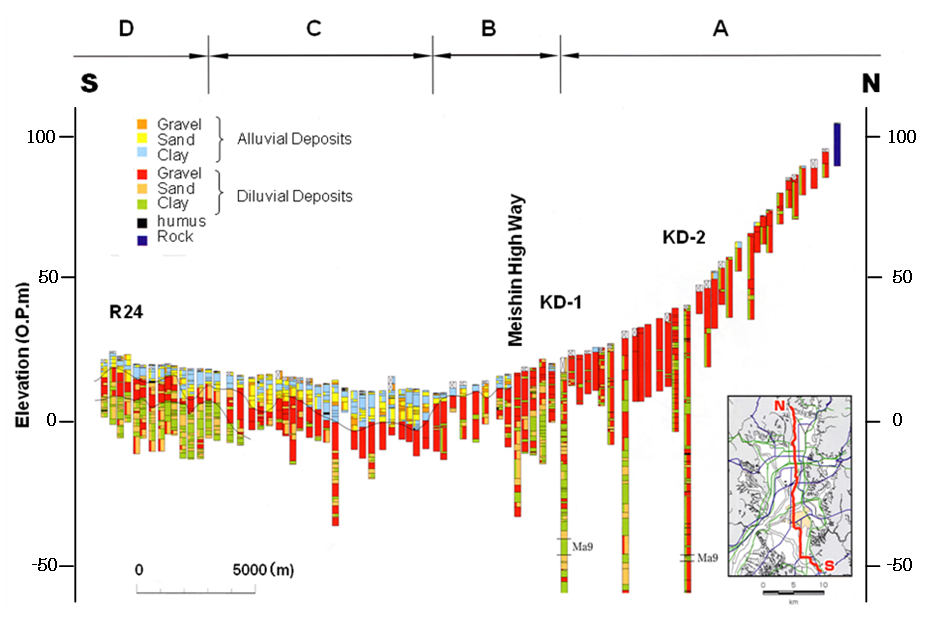 | Figure 4. Example of the cross-sectional east-west view of subsurface ground in Kyoto Basin |
4. Application to Geotechnical Problems ~Liquefaction Assessment~
Liquefaction has been highlighted since serious disaster induced by liquefaction occurred at Niigata Earthquake and Alaska Earthquake in 1964. A number of procedures for assessing liquefaction have been proposed and updated on the basis of the records of liquefaction by earthquakes taking place one after another. Laboratory tests such as undrained cyclic triaxial tests on reconstituted sand specimen have played significant roles for those studies on liquefaction. It is true that the experimental approach is important to know the mechanism of liquefaction, but the results from laboratory tests often have not provided a reasonable solution for the actual liquefaction disaster because liquefaction in the field is definitely the boundary value problem far from the laboratory conditions. In the practical sense, the regional distribution of hazardous area against liquefaction due to earthquake can provide very important and useful information for disaster mitigation. For this purpose, geo-database can function efficiently. In this chapter, simplified procedure assessing liquefaction potential is introduced and applied to evaluate the regional liquefaction potential based on the geoinformatic database.
4.1. Simplified Procedure Based on the Geoinformatics Database
The simplified procedure assessing liquefaction potential used in the present paper is a so-called FL method specified in the “Specifications for highway bridges” by Japan Road Association [8]. This method has commonly used in Japan for designing the foundations. First, the safety factor against liquefaction, FL is defined as follows:  | (1) |
Here, R denotes a liquefaction resistance and calculated by  . The parameter, cw is a correction factor depending on the type of earthquake. RL is a cyclic stress ratio defining liquefaction in the laboratory. This parameter is usually derived from NSPT values from standard penetration test (SPT) because it is not so common to carry out the undrained triaxial cyclic test on good quality sand samples. SPT is a simple and economical method to know the resistance of the foundation ground in the field, and commonly carried out for subsoil investigation. Naturally the Geo-database has the data of NSPT profiles for almost all boring logs. Therefore, it is advantageous to introduce the present procedure for liquefaction assessment based on the NSPT values. RL can be calculated by the following equations:
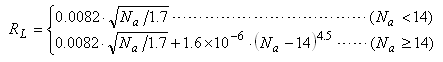 | (2) |
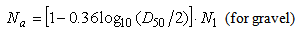
Here, Na is a corrected NSPT value in terms of the effect of fine components and expressed as follows: 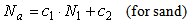 | (3) |
 | (4) |
Here, N1 is a corrected NSPT value in terms of confining stress. As is easily known, Na can be calculated with mean particle size, D50 (in mm) and N1 whereas more effect of fine components should be taken into account for sand with the correction coefficients c1 and c2. The coefficients c1 and c2 are assumed as follows: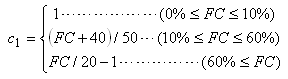 | (5) |
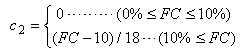 | (6) |
Here FC denotes fine components less than 74μm of diameter included in sand. As stated here, the liquefaction resistance, RL can be derived from NSPT values. The parameter, L denotes shear stress ratio mobilized in the ground during an earthquake and is expressed in the following form: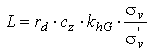 | (7) |
Here, σv and σ’v are total and effective overburden stresses in kgf/cm2, cz is a regional correction factor (cz = 1.0 for Osaka, Kobe and Kyoto) that is determined on the basis of the probability of earthquake occurrence, khG is a horizontal seismic coefficient at the ground surface. The parameter, rd is a reduction factor of the shear stress ratio during an earthquake in the vertical direction to consider the non-rigid response of the ground and expressed as follows: 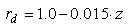 | (8) |
Here, z denotes a depth from the ground surface. Soil layers with FL value larger than 1.0 are considered to be non-liquefiable while liquefaction potentially takes place in the case of FL ≤1.0. It is true that FL denotes the safety factor at a certain depth but the integrated safety factor, PL (Figure 5) is considered to represent the liquefaction of mass foundation, which directly induces serious geotechnical disaster. In the sense, PL has been selected as the index for assessing liquefaction potential of regional ground in this paper. The integrated safety factor, PL against liquefaction is defined as follows [9]: 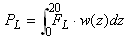 | (9) |
Here, w is a weighting function in terms of depth. Values of FL are determined to be zero for FL ≥1.0 whereas 1- FL for FL <1.0. 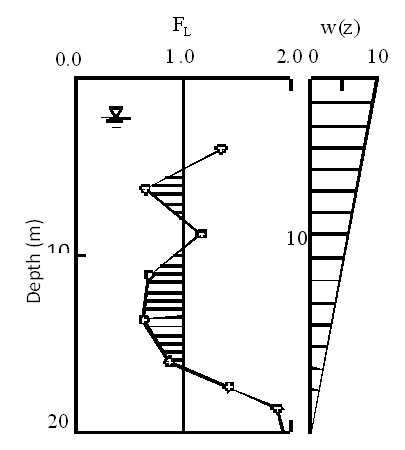 | Figure 5. Derivation of liquefaction potential, PL |
4.2. Calculated Performance for the Osaka Plain
On the basis of the development of evaluation procedure for liquefaction potential after 1995 Hyogoken-Nambu Earthquake, the assessment of liquefaction potential of Osaka Plain has been updated. In the present section, the latest outcome for the liquefaction potential of Osaka Plain [10] is explained following the prescribed scenarios of the earthquake occurrence. The flowchart of the assessment procedure is shown in Figure 6. The simplified procedure in terms of PL method was also introduced, as is the case of Kobe and the adjacent area. 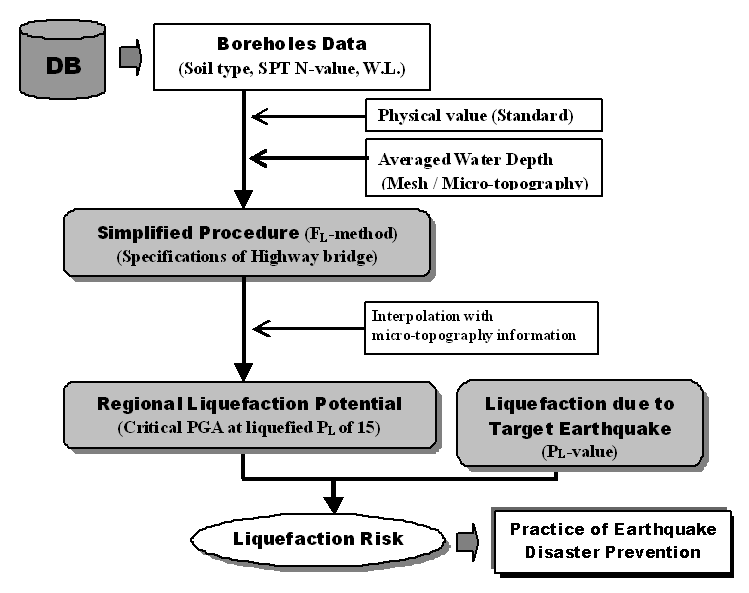 | Figure 6. Flowchart of liquefaction assessment with simplified method |
Each municipal office of local governments has earnestly begun to establish an action plan for earthquake disasters. The realistic action plan has to be associated with the possible earthquake disaster. For that purpose, the scenario earthquakes should be set on the basis of the knowledge by seismology and earthquake engineering. In the present section, the earthquakes induced by the Uemachi Fault, the typical and influential near fault earthquake, and by Tonankai/Nankai Earthquake, typical subduction zone earthquake, which hit Japan with 100 to 140 years interval are introduced for assessment. The hybrid method has been introduced to derive the realistic ground motion. The seismic ground motion on the engineering basement with S-wave velocity of more than 500m/s is calculated by the hybrid method with the Stochastic Green’s Function Method and the 3-Dimensional Finite Differential Method. At the same time, the free surface response is considered based on the equivalent linearization technique and/or nonlinear analysis. Calculated distribution of PL values of Osaka Plain is shown in Figure 7 (a) for Uemachi Earthquake and (b) for Tonankai/Nankai Earthquake based on the prescribed scenarios. As shown in Figure 7 (a), the expected liquefied area (PL is larger than 15) is concentrated along the fault where the severe earthquake-induced acceleration is predicted because the Uemachi Fault is a reverse one situated in the central Osaka Plain. On the contrary, little liquefaction is expected to occur on the Uemachi Plateau where they have no soft soils in the ground. Liquefaction is also expected along the coast of Osaka bay as well as the areas along rivers where soft soils are normally situated with relatively high underground water table. It is found that serious liquefaction-induced disaster takes place all over Osaka Plain when the Uemachi Fault breaks. Figure 7 (b) shows the distribution of PL values due to Tonankai/Nankai Earthquake. It is true PL values are high for the coastal area as well as the areas along rivers but compared to the case of the Uemachi Earthquake, we have smaller PL for this subduction zone earthquake because the maximum acceleration expected by this earthquake is not so large. Liquefaction disasters by this subduction zone earthquake seems to be more mild for the present scenario by the estimated PL values while the easily liquefied area is widely expected to distribute. However, it does not mean that the possible liquefaction-induced disasters by Tonankai/Nankai Earthquake because the effect of long-term duration of tremor by the subduction zone earthquake on the liquefaction is still unknown. The assessment of the important facilities against liquefaction has to be conducted with more sophisticated manner such as the finite element analysis based on the effective stress. | Figure 7. Liquefaction assessments in terms of the calculated distribution of PL for (a) near fault earthquake (Uemachi Fault) and (b) subduction zone earthquake (Tonankai/Nankai Earthquake) |
As is the case for Kobe area, the critical acceleration that is defined as the acceleration by which the estimated PL value becomes 15 is calculated as a threshold for the occurrence of liquefaction-induced disasters [11] also for Osaka Plain. The distribution of the critical accelerations for Osaka Plain is shown in Figure 8 (a) by the near fault earthquake and (b) for the subduction zone earthquake respectively. In both figures, seriously fragile area coincides with the heart of Osaka metropolitan zone. The lowlands along Yodo River as well as the reclaimed coastal area also cannot resist against liquefaction. The main reasons for those results consist in the facts that they have thick weak sandy deposits on the very thick sediments together with high groundwater tables. As the impact of the earthquake intensity by the near fault earthquake is stronger, the induced hazard by the liquefaction is more serious compared to the subduction zone earthquake with much more huge magnitude. However, another factor of duration of tremor should be considered for the subduction zone earthquake. The seismic wave with a long period is expected to propagate and keep on hitting the Osaka Plain in the case of the subduction zone earthquake, such as Tonankai/Nankai Earthquake. In summary, the level of acceleration expected on the Osaka Plain by the subduction zone earthquake is not so severe, but the tremor continues for a long time. Here, the question arises; “Does the present evaluation with the simplified procedure based on the acceleration function well?” The contribution of the long duration of tremor with relatively low acceleration to the occurrence of liquefaction could be an issue. 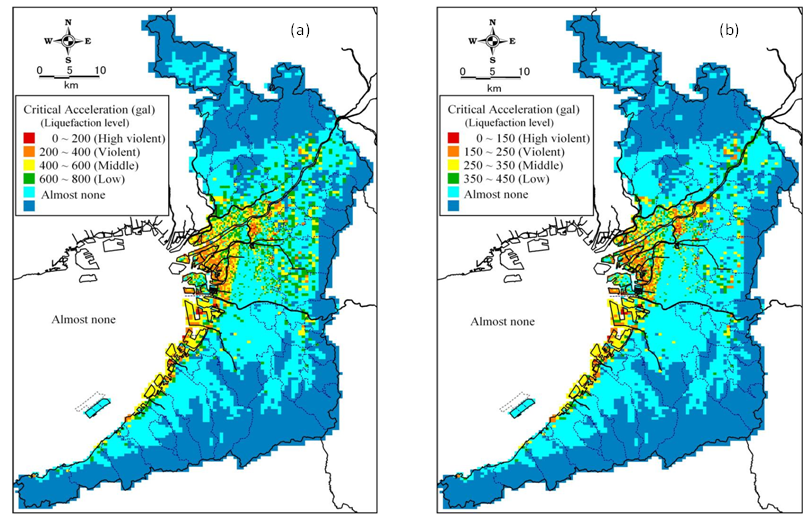 | Figure 8. Fragility for liquefaction in terms of critical acceleration that induces liquefaction for (a) near fault earthquake (Uemachi Fault) and (b) subduction zone earthquake (Tonankai/Nankai Earthquake) |
5. Representative Soil Profile Model
Representative soil profile model is defined as a set of soil models of the Holocene layers that are developed for 250m square mesh with the nation-wide prescribed standard code. It is true the present existing geoinformatic databases have been utilized mainly for disaster mitigation analysis but we still have serious problems shown as follows: (1) It is not easy to unite individual geoinformatic databases that have been locally developed independently because the procedure to develop databases is not always the same and the data contained in the individual database are manifold. (2) Not all existing databases are freely accessible because various regulations are imposed for opening to the public based on the ownership for boring data included in databases. In order to overcome the above shortcomings, the idea of RSPM has been contrived [12]. RSPM is developed by collecting individual boring data in the geoinformatic database in the target mesh with 250m square, and the representative soil types and properties are rationally determined with depth based on the professional knowledge of topography, geology and geotechnology. The modeling with professional interpretation guarantees RSPM to be reliable and user friendly. Additionally, RSPM can be open to the public without any difficulties because the completed RSPM no longer contains individual information of each boring that is often regulated by the ownership. RSPM should be utilized for disaster mitigation planning by municipal sectors, evaluation of nation-wide geotechnical condition and basic information to purchase a residential lot.
5.1. Procedure to Develop RPSM
A procedure to develop RSPM is shown in Figure 9 [13]. Individual local geoinformatic databases and RSPM are sound foundations for the nation-wide RSPM. It should be emphasized that even local RSPM has to be developed by the nation-wide prescribed standard code to keep common structures among them. The basic concept to develop RSPM advances as follows: (1) The base data are prepared based on the local geoinformatic database supported by the accumulated topographical, geological and geotechnical research. (2) Representative soil information for 250m square mesh is extracted. (3) Design soil layers are set and sorting the data within the target mesh.(4) Representative soil profile models are completed. 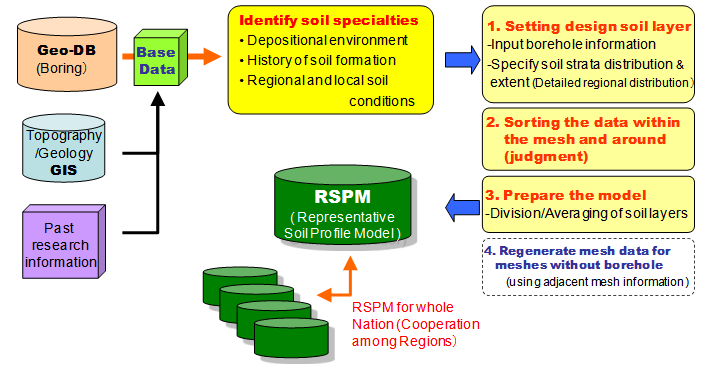 | Figure 9. Procedure to develop Representative Soil Profile Model (RSPM) |
Here, note that the irreducible minimum information should be installed to keep an equivalent quality among the individual RSPM considering the networking and unification. The names of soil classification are designated as gravelly soils (G), Sandy soil (S), Clayey soil (Cs), Organic soil (O), Volcanic fine soil (V), Peaty soil (Pt) and Artificial soil (Am) by obeying the JGS standard.Figure 10 shows the operating windows of the supporting system for RSPM development. First, the target soil layers are set for individual borings in the target mesh. At present, the target soil layer is designated as the Holocene one. Secondly, the necessary soil data inside the mesh and the adjacent mesh are acquired considering the representative soil characteristics. At the time, the selected borings are shown as a columnar chart with the Holocene borders. Thirdly, the appropriate soil columnar model for the target mesh is developed from the selected boring data. During this process, the boring data that do not represent the geotechnical characteristics of the target mesh are eliminated. In the present procedure, the soil layers are divided into every 2m thickness. The predominant soil type is selected as a representative with the average NSPT and soil properties. The derived soil model and the spatial image of the model are also shown in Figure 10. Finally RSPM for a certain area is developed by unifying the individual soil model.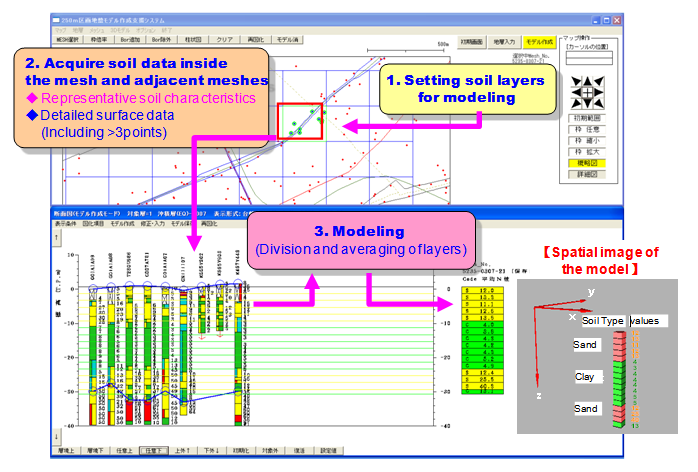 | Figure 10. Operating window of the supporting system to develop Representative Soil Profile Model (RSPM) |
5.2. Example of RSPM for Osaka Basin
The area of 10km square in the heart of Osaka is selected as a pilot area for developing RSPM. This area is characterized by the existence of the Uemachi Upland of the Pleistocene origin that divides Osaka Plain into western lowland with coastal reclaimed area and eastern Osaka Plain. Various subsoil conditions can be encountered in this target area, namely, almost flat thick Holocene clay is widely situated in western Osaka Plain whereas very sensitive Holocene clays locally exist on the buried valley in eastern Osaka Plain. Those characteristic subsoil conditions have been reported in detail [6]. Figure 11 shows the distribution of the number of borings in individual mesh with 250m square. Proportion of the number of borings in 250m mesh in Osaka Plain is shown in Figure 12. As is shown clearly, 40% of all meshes contain more than 4 borings because the big metropolis such as Osaka city has a large number of borings due to sufficient number of construction projects. On the other hand, 40% of all meshes contain less than 2 borings and 12% of all have no boring in the 250 square area. We have to adopt the rational scheme for interpolation for such vacant meshes.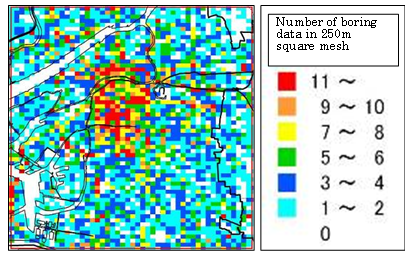 | Figure 11. Distribution of the number of borings in 250m square mesh in the Osaka Plain |
Here, when appropriate boring data are selected to develop the representative soil profile model, we have to attach importance to the following points. (1) The selected borings should exhibit the topographical, geological and geotechnical characteristics. (2) The scheme should be free from a personal arbitrariness. (3) The scheme should hold enough efficiency and be plain. Considering the above-mentioned demands, three different methods have been introduced to develop RSPM as follows: Method A: All boring information in the target mesh is implicitly averaged. Method B: Boring data are added from the surrounding areas with the 1.5 times of the target mesh. Then, all boring information including the subjoined one is implicitly averaged. Method C: Appropriate borings are selected to reflect the topographical, geological and geotechnical characteristics of the target mesh. All boring information selected is averaged. For the present pilot study, when the number of borings in the mesh is more than three and the borings distribute uniformly (see Figure 12), Method A is adopted because this method is the easiest and completely free from personal arbitrariness. When the number of borings is less than 2 and/or the distribution of boring location seems unbalanced even if we have sufficient borings, Method B is adopted to increase the number of borings and reflect the representative geotechnical characteristics of the target mesh. Both Method A and B are adopted for the meshes whose subsoil condition is rather uniform and stable. However, in the case that the subsoil condition is non-uniform or changes drastically, those methods cannot be adopted even if we have sufficient number of borings in the target mesh. When the complicated subsoil condition is expected such as fault effect and existence of buried valleys and so on, Method C has to be adopted. It is not automatically determined which methods should be used for a certain mesh. Topographical, geological and geotechnical experts can judge which ones to be adopted on the basis of their scientific knowledge. In the present pilot study, Kansai Geoinformatic Database has functioned well to evaluate the subsoil conditions of Osaka Plain. Produced example of RSPM is shown in Figure 13. The target mesh has only 2 borings and they are also non-uniformly located at the north of the mesh. Under this circumstance Method A provides the model of sandy layers underlain by gravel stratum. To overcome non-uniform distribution of the borings Method B is also applied by subjoining another 2 borings from the adjacent mesh obeying the rule to enlarge the target area by 1.5 times. Then, the derived model consists of clayey soils having sandwiched gravelly layer due to too much effect of the existence of clayey deposit in the southern mesh. According to Kansai Geoinformatic Database, clayey stratum becomes poorer towards west and sandy layer holds mode gravels in this area. Based on this scientific knowledge, the authors selected 2 borings from the adjacent southern mesh by eliminating 2borings selected for Method B. Then Method C provides the model of alternating clayey and sandy layers underlain by gravel stratum. Because geographical and geological interpretation has support the subsoil model by Method C, the model by Method C has become RSPM for this mesh. 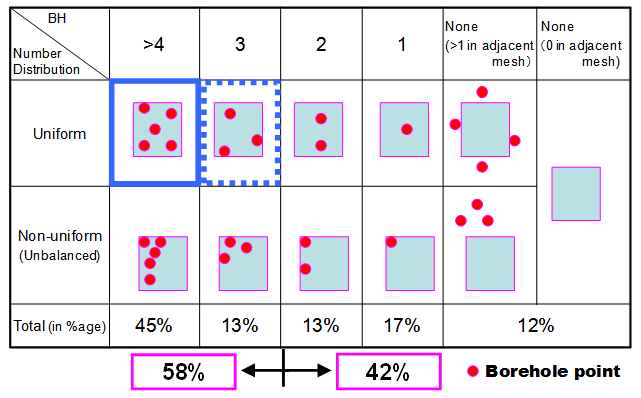 | Figure 12. Proportion of the number and pattern of location of borings in 250m square |
A representative cross-sectional view of subsurface ground for Osaka Plain is shown in Figure 13. The selected line is the one through the downtown Osaka on the north of the Osaka Castle. Uemachi Upland is located in the heart of Osaka where all strata are tilting by the prevalence of folded structure developed by the tectonic movement of the Uemachi Fault. On the west side of Osaka, the thick Holocene marine clay (Ma 13) layer exists underlain by the Pleistocene gravel layer and the alternating Pleistocene deposits. The strata are rather stable and horizontally sedimented. On the eastern part of Osaka, the basin structure can be seen between the Uemachi Upland and the Ikoma Mountains. The Holocene clay in this region is well-known as sensitive clay. The characteristic subsoil structure of the Osaka Plain is found to be well represented by the RPSM.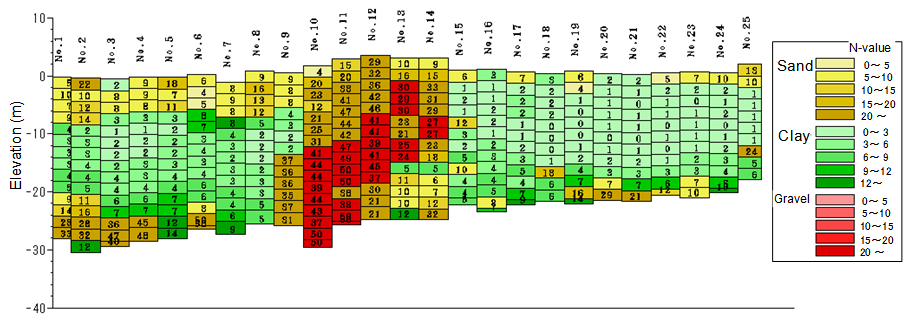 | Figure 13. Example of cross-sectional view for subsoil stratification of Osaka Plain by “Representative Soil Profile Model” (Each column is a representative in 250m square mesh) |
6. Conclusions
The present status of geoinformatic databases is Japan was briefly introduced. Various geoinformatic databases have recently been developed under the auspices of associations, national or local government and private sectors and utilized for geotechnical research, construction planning and assessment of disaster mitigation etc. The example of subsoil structures for Osaka Plain and Kyoto Basin were exhibited on the basis of Kansai Geoinformatic Database. The subsoil structure of Osaka Plain as a deltaic plain with the fault is completely different from that of Kyoto Basin as an alluvial fan. It should be noted that geological interpretation is indispensable to make the quality of the individual geoinformatic databases higher because the environment of sedimentation and the tectonic movement remarkably reflect the subsoil stratigraphy. The Kansai Geoinformatic Database is utilized for the research of local foundations in Kansai, the primary information to construction projects and political assessment of disaster mitigation etc. As a typical example, the application to the assessment of liquefaction is explained in the present paper. Huge number of boring data is required to assess the liquefaction potential for metropolitan area like Osaka to cover the whole widely spread area. In the case, the geoinformatic database can easily provide the necessary geological and geotechnical information which are directly connected to the various procedures to evaluate liquefaction and the induced geo-disasters. The expected earthquakes are assumed to occur and the scenario earthquake induced forces are calculated based on the knowledge of seismology and earthquake engineering. The simplified method provided the local fragility for liquefaction in terms of “critical acceleration” to derive PL values of 15 that coincides with the occurrence of serious liquefaction induced disasters. On the other hand, the distribution of PL values calculated using the scenario earthquakes (near fault and subduction zone earthquakes) exhibited the same mode of liquefaction occurrence qualitatively. Long-term tremor is another point of discussion to evaluate the liquefaction potential when the subduction zone earthquake, such as Tonankai/Nankai Earthquake hit Kansai area because the present procedures have never been validated for such type earthquake yet. Representative Soil Profile Model (RSPM) has been developed by collecting individual boring data in the target mesh with 250m square, and the representative soil types and properties are rationally determined with depth based on the professional knowledge of topography, geology and geotechnology. RSPM is constructed with the nation-wide standard code to have a common structure among the individual RSPM considering the networking and unification. The fundamental concepts for RSPM are as follows: (1) Selected borings should exhibit the topographical, geological and geotechnical characteristics. (2) The scheme should be free from a personal arbitrariness. (3) The scheme should hold enough efficiency and be plain. 10km square of Osaka Plain has been selected as a pilot site for RSPM. Considering the subsoil conditions, we have to use different procedures to develop the representative soil profile models for the target meshes. A due attention should be paid to the case in which the complicated subsoil condition is expected such as fault effect and existence of buried valleys and so on. It is noted that non-automatic procedure with topographical, geological and geotechnical interpretation should be introduced to develop RSPM for the area with the complicated subsoil condition. The nationwide project to link the individual databases by introducing the concept of RSPM is being advanced in Japan to make the seamless subsoil model in the equivalent quality.
References
| [1] | H. Todo, K. Yamamoto. Geological Models and Geotechnical Models -Lessons from Development of Japan-wide Geotechnical Ground Models -. Proc. of Conference on the 3rd Geohazard Information Zone and the 5th Seminar and Short Course of HASTAG: 2014, (in printing). |
| [2] | ATC10 UrbanGeo-informatics. Case Histories of Urban Geo-informatics –the first draft-.: 2003, 104p. |
| [3] | Y. Tanaka, and Y. Tsukada. Geotechnical Database of Kansai - History and Developments- Proc. of the International Symposium on Geo-informatics and Zoning for Hazard Mapping: 2009, pp.85-92. |
| [4] | K. Yamamoto, Y. Iwasaki, and S. Suwa, S. Concept and Development for Database System of Geotechnical Engineering Information”, Proc. 34th soil engineering symposium, JGS, 1989, pp.195-202 (in Japanese). |
| [5] | Y. Iwasaki, S. Suwa and K. Yamamoto. Concept and Development of Geotechnical Database System for Regional Geotechnical and Geological Iinformation. Geoinformatics, Vol.1, No.1, 1990, pp.103-113 (in Japanese). |
| [6] | Geo-Database Information Committee of Kansai. Shin Kansai Jiban -Osaka Plain-, 2007,450p., (in Japanese). |
| [7] | Geo-Database Information Committee of Kansai. Shin Kansai Jiban -Kyoto Basin-, 2002,196p., (in Japanese). |
| [8] | Japan Road Association. Earthquake resistant design, specifications for highway bridges. 2012, 318p., (in Japanese). |
| [9] | T. Iwasaki, F. Tatsuoka, K. Tokita and S. Yasuda. Estimation of Degree of Soil Liquefaction During Earthquake, TSUCHI-TO-KISO, Vol. 28, No. 4, 1980, pp.23-29, (in Japanese). |
| [10] | M. Mimura and K. Yamamoto, Development of Geo-database and Its Utilization for Assessment of Liquefaction. Proc. International Geotechnical Symposium "GEOTECHNICAL ENGINEERING FOR DISASTER PREVENTION & REDUCTION", 2007, pp. 91-102. |
| [11] | F. Oka, F, M. Mimura and K. Yamamoto. Liquefaction Due to Hyogoken-Nambu Earthquake and Prediction Methods. Proc. Symp. on mechanism of liquefaction and prediction & design methods for liquefaction, JGS, 1999, pp.511-516, (in Japanese). |
| [12] | M. Mimura and K. Yamamoto. Representative Soil Profile Model Based on Geoinformatic Database. Proc. International Symposium on Geoinformatics and Zoning for Hazard Mapping, 2009, pp. 71-78. |
| [13] | M. Mimura and K. Yamamoto. Development of Representative Soil Profile Model Based on Geoinformatic Database. Proc. International Symposium and Exhibition on Geoinformation 2008, Keynote Session 1, CD-R, 2008. |
 Abstract
 Reference
 Full-Text PDF
 Full-text HTML