-
Paper Information
- Next Paper
- Previous Paper
- Paper Submission
-
Journal Information
- About This Journal
- Editorial Board
- Current Issue
- Archive
- Author Guidelines
- Contact Us
International Journal of Ecosystem
p-ISSN: 2165-8889 e-ISSN: 2165-8919
2015; 5(3A): 47-54
doi:10.5923/c.ije.201501.07
Prioritizing Options for Removal of Arsenic Contamination in Daily Food Using Ridit Analysis
 Abstract
 Reference
 Full-Text PDF
 Full-text HTML
Swati Mollah
Dumkal College, Basantpur, Murshidabad
Correspondence to: Swati Mollah, Dumkal College, Basantpur, Murshidabad.
| Email: |  |
Copyright © 2015 Scientific & Academic Publishing. All Rights Reserved.
Murshidabad district practices rice cultivation with irrigation from groundwater. The shallow tube-wells installed for agricultural irrigation contain average arsenic of 0.094 mg/l and drinking water contains 0.11mg/l. The mean arsenic levels in food categories in the study area are vegetables 21.2μg/kg, cereals and bakery goods 179μg/kg and spices 202μg/kg (Roychowdhury et al., 2003). Although six arsenic removal plants had been previously installed in the village, the villagers are still exposed to elevated levels of arsenic daily. 92.6 per cent of analyzed biological sample contained arsenic at above normal levels in the area (Rahaman et al., 2005). The paper tries to explore the perception of farmers towards the management of arsenic contamination problem in their locality through sample survey in Murshidabad district using RIDIT analysis. The paper finds that the respondents have limited knowledge about the arsenic contamination in foods and they are not aware about the sustainable management options also. They emphasise on the improvement of overall economic condition of the area, establishment of more water test centers and govt. regulations on groundwater extraction etc. to manage the contamination of arsenic in food.
Keywords: Arsenic contamination, RIDIT Analysis, Risk perception
Cite this paper: Swati Mollah, Prioritizing Options for Removal of Arsenic Contamination in Daily Food Using Ridit Analysis, International Journal of Ecosystem, Vol. 5 No. 3A, 2015, pp. 47-54. doi: 10.5923/c.ije.201501.07.
Article Outline
1. Introduction
- Indiscriminate use of the rivers and streams as pathways of sewerage and industrial waste by the Bengal basin inhabitants has made the surface water impotable. Moreover, the introduction of high-yielding winter paddy accelerated the demand for irrigation. This led to the shift of water supply policy from surface water to groundwater in both West Bengal and Bangladesh during the early 1970s. As a consequence, several million wells (ranging from low yielding hand pumped to heavy-duty motor-driven) were installed in order to meet drinking, irrigation, and industrial water demands. However, by the 1990s, a large part of the Bengal basin groundwater was determined to have elevated concentration of arsenic (As), which can impact human health at concentration of 10μg/l in drinking water (WHO, 1993). It has been hypothesized that the non-point source, geogenic As, mostly occurs in the Holocene shallow aquifers of the Bengal basin and probably has been mobilized from the sediments by redox reactions (Bhattacharya et al., 1997; Nickson et al., 1998). People in this affected area are chronically exposed groundwater arsenic contaminated hand tube-wells water. With every new survey, new arsenic affected villages and people suffering from arsenic related diseases are being reported and the problem resolving issues are getting complicated by a number of unknown factors. Further to those, arsenic groundwater contamination has far-reaching consequences including its ingestion through food chain, which are in the form of social disorder, health hazards and socio-economic dissolution besides its sprawling with movement, and exploitation of groundwater.
2. Research Problem
- Groundwater arsenic contamination in the Bengal Delta has been termed as the largest mass poisoning in history of human kind (Smith et al. 2000). Groundwater of nine out of total 18 districts of West Bengal has been contaminated with arsenic (Nickson et al. 2000; Chakraborty et al. 2002). Elevated levels of arsenic in agricultural fields due to the application of arsenic-contaminated groundwater for irrigation have been reported over the years (Mandal et al. 1996; Rahman et al. 2007). The accumulation of arsenic in rice is viewed as a newly recognized disaster for South-East Asia, where rice is a staple food (Meharg 2004). Arsenic can find its way into the grains of plants, such as rice and wheat, and into some vegetables and fruit plants through irrigation with arsenic-contaminated water (ICAR report 2001; Roychowdhury et al. 2002). Abedin et al. (2002) observed the accumulation of arsenic up to 92.0 mg kg-1 in rice straw through a green house pot experiment. Many researchers reported that food is the second largest contributor to arsenic intake by people after direct ingestion of arsenic contaminated water. In food, rice is the maximum sensitive to arsenic followed by vegetables. When arsenic contaminated groundwater is used for crops irrigation, a part of this arsenic becomes incorporated into the food chain. Many investigators consider water- soil- crop- food transfer, cooking water, and direct ingestion of arsenic contaminated water as the major exposure pathways of arsenic. Over 75% of this arsenic present in the crops is inorganic in nature (Roychowdhury, 2002). The effects of this occurrence are far-reaching. First, as the people take in contaminated water along with contaminated food, the chances of damage become greater. Secondly, the food crops are sold off to other places, including uncontaminated regions where the inhabitants may consume arsenic from the contaminated food. Thirdly, the domestic animals, like cattle etc, in arsenic- affected areas regularly take in arsenic along with their drinking water and food, like straw. If human beings consume the meat from such infected animals, they may consume arsenic as well. Almost all parts of West Bengal uses rice as its staple food. In the study area rice and vegetables are the main food composites for the villagers. Normally, the villagers eat rice with vegetables three times daily. They cook vegetables with spices at hot taste. Green chili and onion is very common with every meal. Due to irrigation with contaminated water, rice grains could have excessive amounts of arsenic. According to a leading scientist, this contamination of rice with arsenic may give rise to a new danger in south-east Asia.
3. Study Area
- Murshidabad district lies centrally in the state of west Bengal, having the geographical extension, 24°50′20″- 23°43′30″N and 88°46′00″- 87°49′17″E. It covers an area of 5,324 km2. The Padma flows down the international frontier between India and Bangladesh on the east of the district. Physiographically Murshidabad district is a part of the lower Gangetic Plain, with a prominent elevation in its north-western fringe due to proximity to Chhotonagpur Plateau (Rajmahal Hill).The district forms a part of the deltaic alluvial plain of the modern Ganga–Brahmaputra delta and is underlain by fluviatile sediments of Quaternary age. Almost entirely the district is made by alluvium brought by a number of dead or dying rivers. The district is comprised of almost flat surface with very gentle slope.
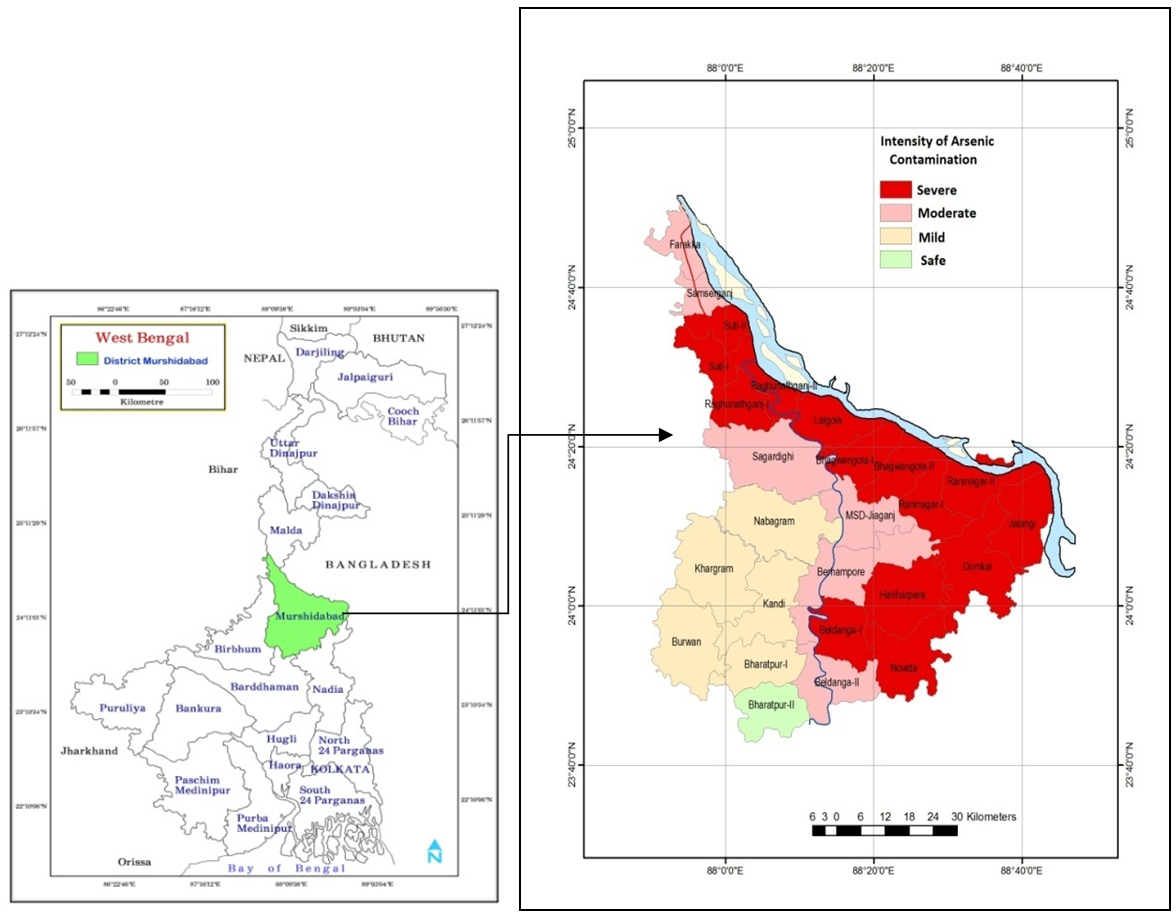 | Figure 1. Location of the study area |
4. Methodology
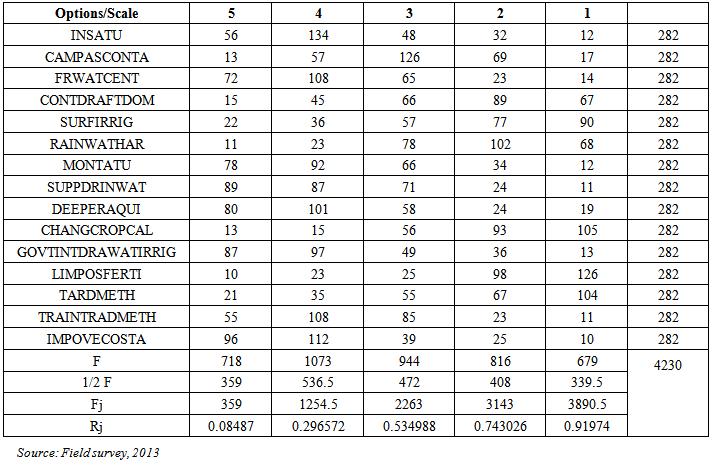
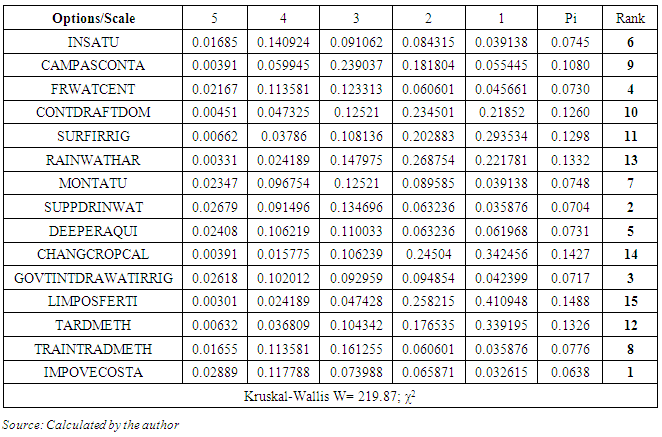
- The study area includes the whole Murshidabad district of West Bengal. The arsenic affected blocks are purposively selected on the basis of intensity of arsenic contamination. The sampling design adopted for the study is a two-stage stratified random sampling with villages as primary units and households as final sampling units. Firstly, the arsenic affected blocks are selected and villages are selected randomly from these blocks. Secondly, by applying simple random sampling the sample households are selected. A sample of size 189 is collected through structured schedule. The schedule is designed using five-point likert scale with respect to different options of management. The options given to the stakeholders are as follows:1. Installation of more ATU plant (INSATU)2. More campaign about As contamination in drinking water& food and their consequences in health (CAMPASCONTA)3. Establishment of water test centre locally (FRWATCENT)4. Control over excess groundwater draft for domestic use (CONTDRAFTDOM)5. Use of surface water for irrigation (SURFIRRIG)6. Rainwater harvesting for irrigation and domestic use (RAINWATHAR)7. Regular Govt. monitoring of ATU plant (MONTATU)8. Provision of supply of safe drinking water by govt. (SUPPDRINWAT)9. Use of deeper aquifers (DEEPERAQUI)10. Change in crop calendar for less use of groundwater in irrigation (CHANGCROPCAL)11. Govt. intervention in limited draft of groundwater for irrigation (GOVTINTDRAWATIRRIG)12. Limited use of phosphate fertilizers (LIMPOSFERTI)13. Removal of As by traditional methods (TARDMETH)14. More training for traditional As removal methods (TRAINTRADMETH)15. Improvement of overall economic status of the stakeholders (IMPOVECOSTA)Then RIDIT analysis was applied on the collected data set to test their relative importance regarding the management options of arsenic removal from drinking water and food from different stakeholders’ point of view. The detail methodology is described below.
5. RIDIT Analysis
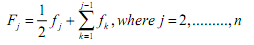
- RIDIT analysis was first proposed by I. Bross and has been applied to the study of various business management and behavioral studies. RIDIT analysis is distribution free in the sense that it makes no assumption about the distribution of the population under study. Suppose that there are m items and n ordered categories listed from the most favoured to the least favoured in the scale, then, RIDIT analysis goes as follows (Wu, 2007) below. 1. Compute ridits for the reference data set (a) Select a population to serve as a reference data set. For a Likert scale survey, the reference data set can be the total responses of the survey, if the population cannot be easily identified. (b) Compute frequency fj for each category of responses, where j= 1, 2,......n (c) Compute mid-point accumulated frequency Fj for each category of responses.

 (d) Compute ridit value Rj for each category of responses in the reference data set.
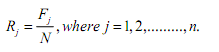 N is the total number of responses from the Likert scale survey of interest. By definition, the expected value of R for the reference data set is always 0.5. 2. Compute ridits and mean ridits for comparison data sets. Note that a comparison data set is comprised of the frequencies of responses for each category of a Likert scale item. Since there are m Likert scale items in this illustration, there will be m comparison data sets.(a) Compute ridit value rij for each category of scale items.
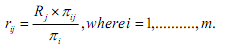
 the frequency of category j for ith scale item,
  is the summation of frequencies for scale item i across all categories i.e.
 (b) Compute mean ridit ρi for each Likert scale item,
 (c) Compute confidence interval for ρi . When the size of the reference data set is very large relative to that of any comparison data set, the 95% confidence interval of any ρi is:
 (d) Test the following hypothesis using Kruskal-Wallis statistics W:
 W follows a χ2 distribution with (m- 1) degree of freedom.
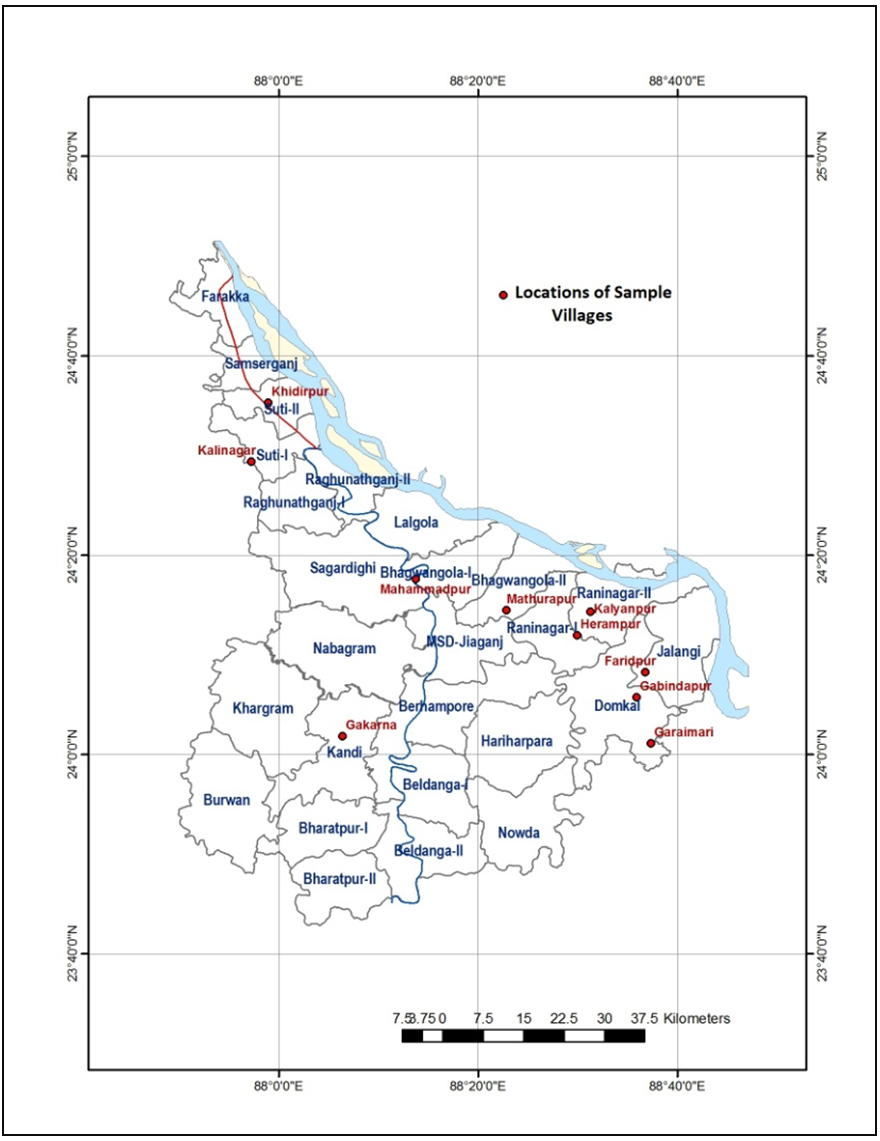 | Figure 2. Locations of the sample villages for survey |
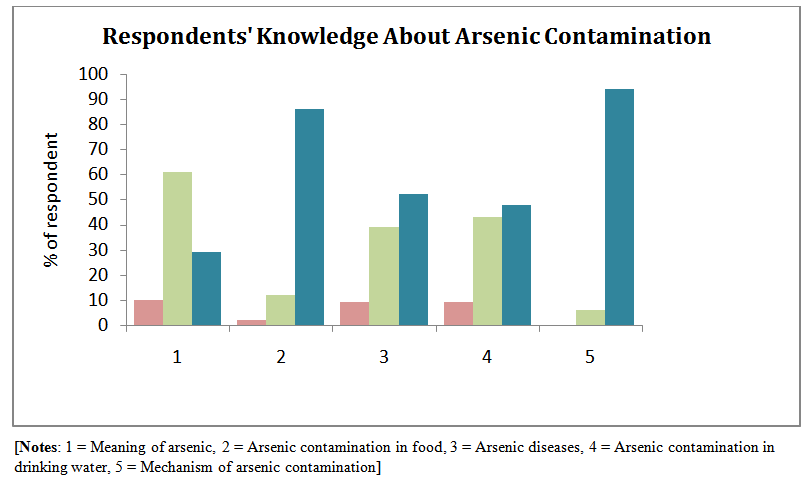 | Figure 3. Respondents’ knowledge about arsenic contamination in their locality; Source: Field survey, 2013 |
6. Results
- The primary survey conducted in the study area reveals very important features regarding the inhabitants’ knowledge about arsenic, the measures taken by them for arsenic removal from water in their households. The survey also finds the suggestive measures given by them to solve the problem of their area.It is found that the respondents do not have a clear knowledge about the term arsenic and associated diseases. More than 60% of the population has only heard the name and arsenic related diseases. Only about 3% of the surveyed population knows about the arsenic contamination of food daily taken by them and their domestic animals. Surprisingly, more than 60% of them are ignorant regarding arsenic in food. 55.5% population does not know the mechanism of arsenic pollution in drinking water though more than 60% of them are well aware about the arsenic contamination in domestic tube-wells.Regarding the removal of arsenic from drinking water the picture is very grave. More than 90% of the surveyed households agree that they have never attended any training or workshop on arsenic contamination in their areas. Only 34% of them tested the water from their domestic tube-wells. Majority of the population are very reluctant regarding the use of surface water for drinking purpose which can solve the problem. 35% of the population takes water from arsenic removal plant installed in their area. 80% of the population has not taken any initiatives to maintain the arsenic removal plant in their locality also. On the other hand more than 50% of them have installed tube-well in their households for getting arsenic free water. The achievement regarding the arsenic removal by traditional way at home is negative in the study area. Many respondents are not well-informed about the dangers of drinking arsenic-contaminated water. But they not at all heard about the arsenic contamination of food composites they every day consume. They are not aware about the contamination of arsenic through the food chain. The contamination could be brought under control by increasing community awareness of the dangers and implementing proper watershed management techniques that involve local people.Next comes the perception part. Risk perception by the general public is essential information in decision making concerning any environmental problem. How people perceive the problem determines their involvement in its protection. Any project can run only by involving villagers. Having discussion with them, inviting their opinion, giving them responsibility, building committees from among them, and, above all, involving their womenfolk will ensure the success of any project.Table 2 reveals the order of preferences as stated by the sample respondents regarding the different options for management of arsenic contamination in drinking water as well as in daily food. They think improvement of overall economic status of the stakeholders and provision of supply of safe drinking water by govt. are the most important alternatives for management of this problem. Basically the respondents are very poor in terms of their economic condition and very much dependent on agriculture. They do not have much opportunity for earning in their locality. They cannot afford the expenses of testing of the water quality, food or soil. These people feel that safe drinking water is only for the rich people. Another thing is that there is no regulation on the amount of draft of ground water for irrigation purposes in their area. So the respondents think that without any control over the draft of groundwater it is not possible to manage the situation. They emphasise upon the govt. intervention on groundwater draft in their locality. Respondents also face problem regarding their easy access to water test centre which are located far distant from their locality. They demand the establishment of more water test centre in their locality so that they can access these centre for frequent testing of their drinking water. Many of the respondents think that use of deeper aquifer will reduce the risk of arsenic contamination in the drinking water.
|
|
7. Conclusions
- People should be made aware of arsenic calamity by mass campaign, training etc. in the study area as the main problem here is related with less knowledge of the respondents about the arsenic contamination in food chain. Water test centers should definitely be established in local areas so that people can have easy access to these test centers. The Government should make and implement strict regulation for boring tube wells as there is no groundwater withdrawal regulation in the state as well as in the district, and as farmers do not have to pay for water, they withdraw more water than they need for the crops. Proper watershed management and villagers’ participation are needed to assist the proper utilization these huge bodies of water. Murshidabad district suffers from flood hazard in one hand and on the other hand the district falls in water scarcity category. It has its own natural topography which favour conservation of excess surface water flowing as trans-boundary flow during monsoon. Surface water restoration by using the topographically depressed parts and its proper utilization can be the excellent options in the study area for water supply during summer. As a permanent solution for providing arsenic-safe water we should consider using our vast traditional known safe water options like surface water, dug wells, rain water harvesting, etc. However, these sources still need to be properly treated against bacterial and other chemical contamination before use. For this the local people have to be encouraged for attending the workshops for removal of arsenic by traditional methods. The mitigation approach needs to be location specific; a universal approach may not suit all the affected areas. Proper watershed management with peoples’ participation is essential.