Nabihah Sihar, Nagaletchumi Balasbramaniam
Center for Communications Service Convergence Technologies, College of Engineering, Universiti Tenaga Nasional, KM7, Jalan Ikram-Uniten, Kajang, Selangor, Malaysia
Correspondence to: Nagaletchumi Balasbramaniam, Center for Communications Service Convergence Technologies, College of Engineering, Universiti Tenaga Nasional, KM7, Jalan Ikram-Uniten, Kajang, Selangor, Malaysia.
| Email: |  |
Copyright © 2015 Scientific & Academic Publishing. All Rights Reserved.
Abstract
Indoor location sensing is vastly deployed in tracking the position and movement of objects and human in an enclosed area. This paper investigates the integration of WLAN and ZigBee for indoor location sensing. K-Nearest Neighbor algorithm is adapted to predict the location of the user in the experimentation area. Indoor environment and resistance of an indoor environment such as walls and movement of objects adversely affect the accuracy of the location prediction. The effect of number of RSS sample collected during the offline and online phase to the accuracy of the location predicted is evaluated.
Keywords:
Indoor Location Sensing, WLAN, ZigBee, K-Nearest Neighbor
Cite this paper: Nabihah Sihar, Nagaletchumi Balasbramaniam, An Indoor Location Sensing for WLAN and ZigBee Integrated Environment, Electrical and Electronic Engineering, Vol. 5 No. 1A, 2015, pp. 23-27. doi: 10.5923/c.eee.201501.05.
1. Introduction
Indoor location sensing is vastly deployed in tracking the position and movement of objects and humans in an enclosed area. Indoor location sensing system provides a new layer of automation which can be utilized for many purposes in various industries. This system can be used for human tracking such as detection the location of a medical personnel in a building or firemen in a building on fire. It can be used for detection of a product in a warehouse, asset management and safety. GPS is widely used all around the world for outdoor positioning. However, GPS has low accuracy when working in indoor due to the attenuation and reflection of signal in building [1]. Therefore, various indoor locations sensing system has been developed and studied for indoor environment. WLAN, Zigbee, Bluetooth and RFID have been deployed for indoor location sensing [2]. All these technologies has its advantages and limitations in supporting indoor location sensing. RFID and Bluetooth based systems are limited detection range because of RFID reader and Bluetooth hotspot only detect object in their coverage [2]. Zigbee is short-range technology and low transfer rate [3].WLAN is dominant medium for indoor location sensing. This is mainly due to the flexibility, connectivity, mobility and low cost of this technology meets the need of the consumers. WLAN IEEE 802.11b has high bandwidth range with a typical gross bit rate of 11 Mbps and general connectivity radius of 50-100m [4].Indoor location sensing system has the best accuracy when all the receiver and transmitter are in line of sight [4]. However, it is almost impossible to accomplish this criteriain real life. There will always be some obstacles along the line. Multipath propagation occurs when the obstacles that is located between the transmitter and receiver deflects the signal. It causes signal fading and affects the accuracy of localization. As a solution, a number of indoor locations sensing algorithms have been developed and studied. They are Time-of-Arrival (TOA) [5], Time-Difference-of-Arrival (TDOA) [6], Angle-of-Arrival (AOA) [7] and Received- Signal-Strength (RSS) [8]. Deployment of TOA, TDOA and AOA is cumbersome and costly tasks as the algorithms require hardware and/or software modifications on APs [9]. On the other hand, RSS-based location sensing can be implemented without any modification on the AP end. Collecting RSS data is a straightforward task. The most esteemed solutions for RSS-based indoor location sensing is the fingerprinting technique. To estimate the user location in fingerprinting technique, different location sensing algorithms such as probabilistic methods, deterministic methods and neural networks, have been proposed. K-Nearest Neighbors (kNN) is the most popular RSS-based location fingerprinting approach used for indoor locations sensing [10].This paper investigates the development of indoor location sensing system in an WLAN and ZigBee integrated environment. K-Nearest Neighbors (kNN) algorithm is adapted for location prediction. The number of RSS samples collected is varied to study the impact to accuracy improvement.
2. K-Nearest Neighbor Algorithm
K-Nearest Neighbors (kNN) is the basic and easiest fingerprint based algorithm widely used for indoor location sensing. Many advanced location sensing algorithm applies kNN as a core building block to further create a more reliable and definite algorithm through the probability models, artificial intelligence or other complex mathematical models.There are two phases in kNN algorithm, namelyoffline phase and online phase. Deployment of kNN algorithm for indoor location sensing requires a predefined database or radio map. The radio map is built from the received signal strength (RSS) of two or more local wireless access points (APs) during the offline phase. During offline phase, reference points (RPs) are selected on a sample floor map. At each RP, reading of RSS values are collectedovera period of time. RSS values from all APs are collected at each RP. This process is repeated at another RP until all the RPsare visited. The offline fingerprint vectors are noted as ki (k1, k2, k3…).During the online phase, the RSS values at RPs collected by Mobile User (MU) is compared with database developed during offline phase. The online fingerprint vectors are known as si (s1, s2, s3…). For each location in the radio map, the RSS root mean square between offline RSS and online RSS is calculated using formula below:
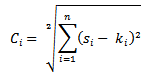 Wherei = Number of location (i = 1, 2, 3, ... , n)si = Online sample vectorki = Offline fingerprint vectorThe Ci is a positive value, where a lower value indicates a smaller difference between the two compared vectors. The lowest Ci indicates the closest approximate location of the mobile user.
3. Methodology
The WLAN and ZigBee integrated indoor location sensing testing is carried out at left wing of College of Information Technology (COIT) building in Universiti Tenaga Nasional (UNITEN). Three floors; 2nd , 3rd and 4th floor are deployed to carry out the testing. The RSS values from WLAN access points are used to identify the floor level of a mobile user while the RSS value from ZigBee access points are used to identify the area on a floor of a mobile user.
3.1. WLAN Setup
WLAN access points are deployed in 3 floors (2nd , 3rd and 4th floor) of left wing of COIT building. The area of each floor is approximately 1600m2. A total of 9 APs are deployed in the testing. Each floor deploys 3 APs. The locations of the APs at all 3 floors are as illustrated in figure 1. This testing is conducted to determine the exact floor of the mobile user (MU). RSS readings from all the 9APs are collected atthe connecting aisle of each floor. The connecting aisle of each floor is divided into 3 areas. In total there are 9locations used for data collection namelyL1 to L9 as illustrated in figure 1. 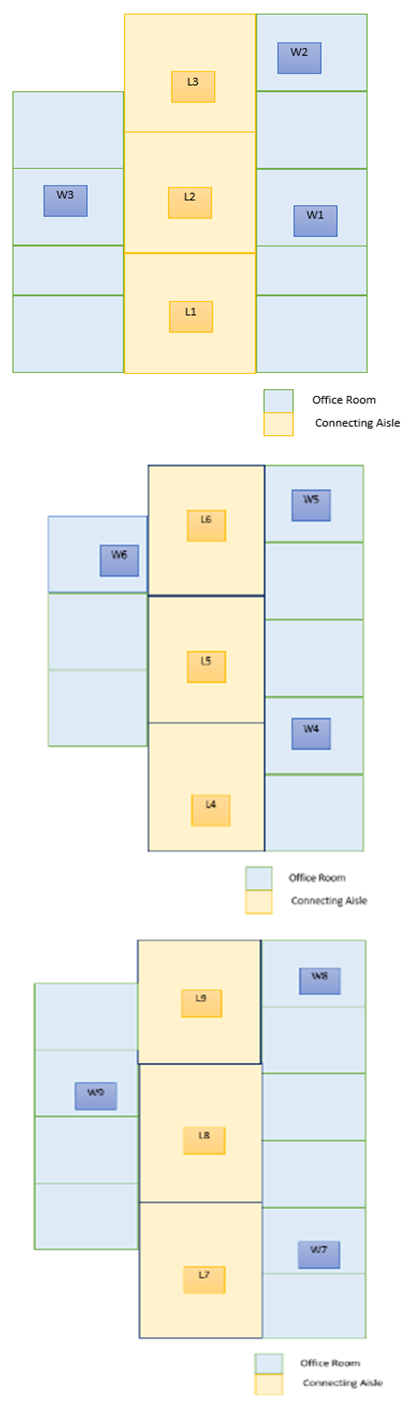 | Figure 1. Floor Layout of 1st, 2nd and 3rd Floor of COIT for 9 APs |
3.2. ZigBee Setup
ZigBee modules are deployed at 2nd floor of the left wing. There are a total of 13 areas, L1 – L13. The connecting aisle is divided into 5 partitions with same area. In this testing, a total of 5 ZigBee modules are deployed. 4 ZigBee acts as routers and one act as a coordinator. This experiment is conducted to determine the exact area of the mobile user (MU) on a floor.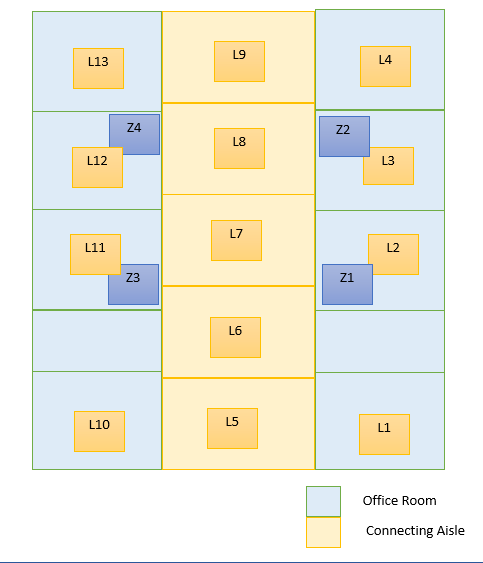 | Figure 2. Floor layout of 2nd floor of left wing COIT |
4. Results and Discussion
4.1. WLAN – Prediction of a Floor Level (2nd, 3rd or 4th) of a Mobile User (MU)
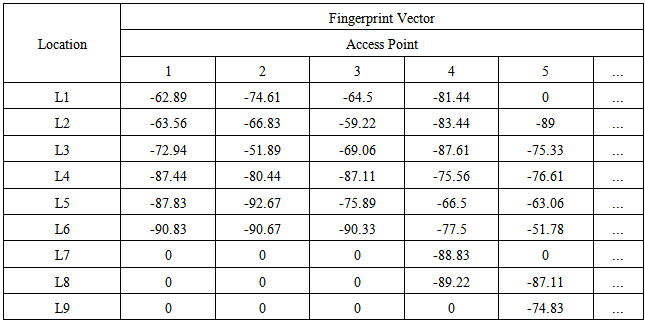
During the offline phase, 10 sample vectors collected atlocationsL1-L9 of the three floors. The value of offline vector for each location is determined by averaging the 10 sample vectors. The resulting averaged fingerprint vectors for each of the nine locations are then tabulated in an offline database system. Table 1 shows an example of fingerprint vector database tabulated during offline phase. All the RSS values are measured in dBm over time. The offline fingerprint vectors are tabulated to form the radio map. Table 1. Example of Offline Database for 9 AP
 |
| |
|
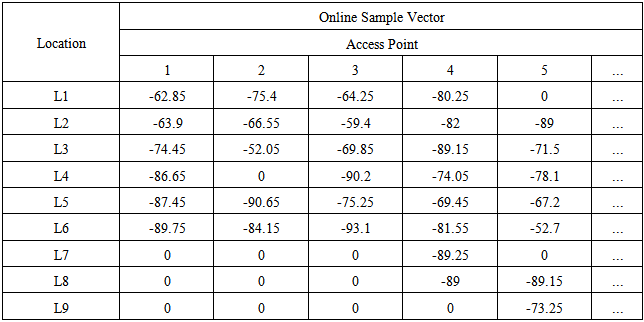
During the online phase, sample vectors of a MU are collected. These samples vectors are compared with the radio map tabulated during the offline phase to prediction the floor level. A total of 3 simulations are carried out at the nine locations, L1- L9. A set of 10 sample vectors are collected for each simulations. Thus, a total of 81 sets of sample vectors comprising of 810 RSS values are taken for this testing.Table 2 shows an example of sample vectors collected during the online phase.Table 2. Example of Online Sample Vector
 |
| |
|
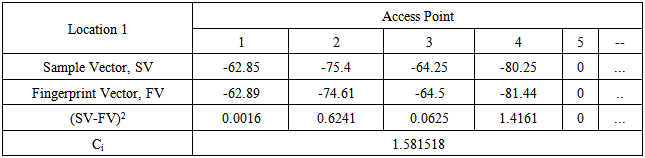
Then, the Euclidean distance between the MU and access points is calculated using the fingerprint vectors and samples vectors formed. An example of the calcualtion is shown in Table 3. Lowest resulting Ci value will the estimation location of the MU.Table 3. Example for Ci Calculation
 |
| |
|
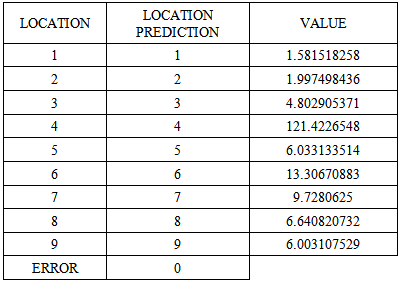
Results of the first simulation is presented in Table 4. Table 4. Result of First Simulation (WLAN)
 |
| |
|
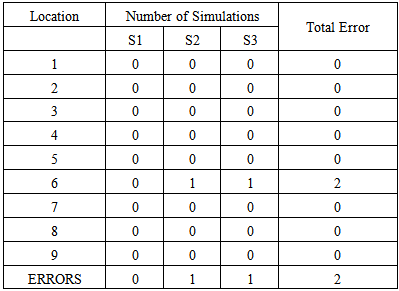
Table 5 shows the prediction errors during the 3 simulations. The percentage of accuracy achieve in prediction the location of the floor level of MU is 92.59%.This value suggests that WLAN based indoor location sensing is suitable to predict the floor location of a MU.Table 5. Prediction Errors for 3 Trials
 |
| |
|
4.2. ZigBee – Prediction of Area Location of a Mobile User (MU) on a Floor
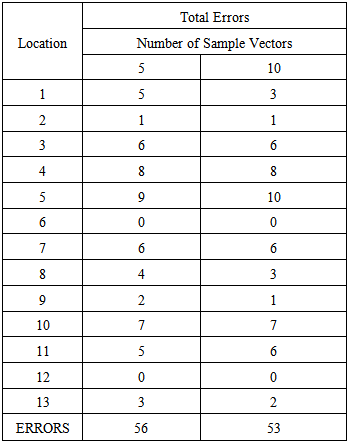
This testing is carried out at 2nd floor of the building. The objective of this test is to predict the location of a MU on a floor. The testing is carried out by collecting 2 sets of sample vectors. One testing is carried out by collecting 5 sample vectors and another one by collecting 10 sample vectors. 10 simulations are carried out for each testing. Same location prediction approach applied as discussed in 4.1. Prediction errors for both of the testing is presented in Table 6 and illustrated in Figure 3.Table 6. Prediction Errors Versus Number of Sample Vectors
 |
| |
|
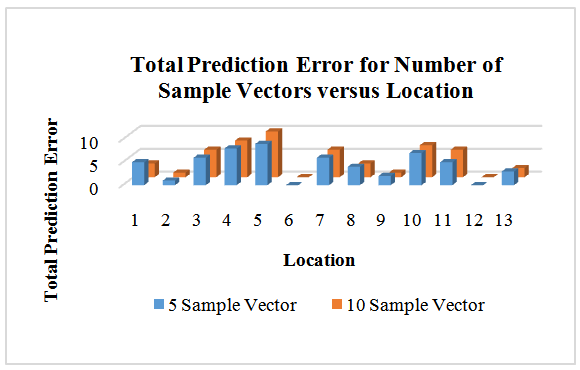 | Figure 3. Total Prediction Errors for Number of Sample Vectors versus location |
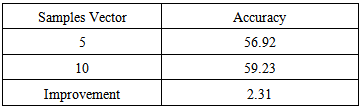
The testing results obtained in predicting the area location of a MU on a floor is not as promising as prediction the location of a floor of MU. The accuracy achieved in the testing is shown in Table 7. Table 7. Difference of precision between the difference Numbers of Sample Vectors
 |
| |
|
There is a slight improvement in the accuracy achieved collecting 10 sample vectors compared to collecting 5 sample vectors. This shows that increasing the number of sample vectors, increases the accuracy of indoor location prediction.
5. Conclusions
Indoor location sensing for a WLAN and ZigBee integrated environment is successfully developed and tested. WLAN is used to determine the floor level of a MU while ZigBee is used to determine an area on a floor of a MU. The WLAN indoor location prediction has achieved accuracy of 92.59%.The ZigBee indoor location prediction has achieved accuracy of 56.92% using 5 sample vectors while 59.23% using 10 sample vectors. An increase in the number of sample vectors, increases the accuracy of indoor location prediction.
References
| [1] | H. Koyunchu and S. H. Yang, "A Survey of Indoor Positioninng and Object Location Systems," IJCSNS International Journal of Computer Science and Network Security, vol. 10, no. 5, pp. 121-128, 2010. |
| [2] | A. Baniukevic, C. S. Jensen, H. Lu, “Hybrid Indoor Positioning With Wi-Fi and Bluetooth: Architecture and Performance”, IEEE 14th International Conference on Mobile Data Management, 2013, pp.207-214. |
| [3] | B. Hao, Z. Chen, S. Feng, “The Study of New Generation of Indoor Positioning Technology Applied in Exhibitions”, Beijing University of Posts and Telecommunications Network Education Institute, 2011 pp399-402. |
| [4] | C. W. Yuen, N. Balasubramaniam and N. M. Din, "Improvement of Indoor Location Sensing Algorithm Using Wireless Local Area Network (WLAN)," in Proceedings of the 2009 IEEE 9th Malaysia International Conference on Communications, Kuala Lumpur, 2009 |
| [5] | M. Llombart, M. Ciurana and F. Barcelo-Arroyo, “On the scability of anovel WLAN positioning system based on time of arrival measurements,” Proceedings of the 6th Workshop on Positioning, Navigation and Communication, 2008. |
| [6] | C. Yang, Y: Huang and X. Zhu, “Hybrid TDOA/AOA method forindoor positioning systems,” Location Technologies, 2007. |
| [7] | R. Yamasaki, A. Ogino, T. Tamaki, T. Uta, N. Matsuzawa and T. Kato, “TDOA location system for IEEE 802.11 b WLAN,” IEEE Wireless Communications and Networking Conference, vol. 4, pp. 2338-2343,2005. |
| [8] | H. Liu, H. Darabi, P. Banerjee and J. Liu, “Survey of Wireless Indoor Positioning Techniques and Systems”, IEEE Transactions on Systems, Man and Cybernetics, Vol 37, 2007. |
| [9] | B. Altintas and T. Serif, “Improving RSS-Based Indoor Positioning Algorith via K-Means Clustering”, European Wireless, 2011, pp.681-685. |
| [10] | C. Feng and W. S. A. Au, "Received-Signal-Strength-Based Indoor Positioning Using Compressive Sensing," IEEE Transactions On Mobile Computing, vol. 11, no. 12, pp. 1983-1993, 2012. |
 Abstract
 Reference
 Full-Text PDF
 Full-text HTML