Santhi Raghavan, Mohd Ghazali Mohayidin, Loo Sin Chun
OUM Business School, Open University Malaysia
Correspondence to: Santhi Raghavan, OUM Business School, Open University Malaysia.
| Email: |  |
Copyright © 2015 Scientific & Academic Publishing. All Rights Reserved.
Abstract
Decreasing retention among new learners at high rates during their early semesters in Open and Distance Learning (ODL) institutions is a phenomenon which concerns ODL operators the world over. In the past decade, there has been a proliferation in the number of higher learning institutions in Malaysia offering ODL-mode courses and programmes that has resulted in exponential growth in student enrolment, generally encompassing adult learners who want to pursue a higher degree for various reasons. As adult learners are completely a different breed of learners compared to traditional learners pursuing full-time courses in conventional universities, this research is to provide conclusive results, which are to be used to work towards successfully reducing their attrition at ODL institutions, and, in turn, increase their completion rates. This is a quantitative research with data collected through online questionnaire. The objective of this research is to identify various factors (both controllable and uncontrollable factors) responsible for learners’ attrition in the first few months of their studies in order to help increase their retention rate for undergraduate and postgraduate programmes, which in turn will maximize university sustainability.
Keywords:
Higher Education, Open & Distance Learning, Adult Learners, Retention, Attrition
Cite this paper: Santhi Raghavan, Mohd Ghazali Mohayidin, Loo Sin Chun, Access to Higher Education via ODL: Addressing Attrition to Maximize University Sustainability, American Journal of Economics, Vol. 5 No. 2, 2015, pp. 208-216. doi: 10.5923/c.economics.201501.26.
1. Introduction
Universities all over the world are facing significant challenges as well as opportunities in the current competitive global context. As Malaysia transforms into an information and technology-driven and knowledge-based society to attain fully developed nation status by the year 2020, and highly-skilled and well-educated workforce is deemed critical in achieving this, many Malaysians are accessing higher education through public and private universities and colleges to acquire qualifications and skills that will enable them to contribute and adapt towards global changes. The Malaysian education system too has reformed to ensure it plays a significant role to all stakeholders. The Ministry of Education (MOE), the Malaysian Qualification Agency (MQA), the Malaysian Qualifications Framework (MQF) and Malaysian Qualifications Register (MQR) ensure quality assurance that the programmes offered in Malaysia, via both conventional as well as ODL, fulfil the standards and criteria set and are accredited.Since the quality of higher education in Malaysia is assured by subjecting to monitoring processes by MQA from time to time to ensure that the programme meet the standards and criteria set and comply with the MQF, the educational clientele now has expanded to include adult learners, in line with technological advancements and industry demands to participate in ODL programmes to add value to their competencies. One such higher education provider that has the most number of adult learners is Open University Malaysia (OUM), which is offering degrees and diplomas right upto PhDs to adult students via open and distance learning (ODL). ODL appeals to Malaysian workforce because of the weekend day-time classes, flexible lecture hours, low programme fee, convenient location of learning centres, wide choice of university learning centres, the proximity to home and familiar surrounding of people and neighbourhood (Santhi, 2009). In addition, courses offered by OUM are carefully developed with adult learners in mind. OUM provides an avenue for adult learners, especially from the working group, to bring their experiences from the workplace to the classroom and bring back theories and concepts learnt in class back to the workplace. In just 11 years, the number of courses in OUM rose from 5 programmes with 753 students, to 80 programmes offered, with about 150,000 cumulative student enrolment (OUM Statistics, September 2014). Because the current economy requires a better-educated worker, and due to the increase in the use of technology in the workplace, adult learners are now seeking higher education (Burns, 2001). However, sadly, the attrition rate among these learners is also high. Nearly 30% of new learners enrolled in their first semester in OUM do not re-register for their second semester and nearly 10% do not re-register for their third semester. Research has indicated that ODL learners have a higher attrition rate than their counterparts in traditional campus-based institutions (Brindley, 1985; Parker, 1995).Learning via ODL has its own sets of problems: workload, family responsibilities, time mismanagement, inability to cope with lessons and assignments, programme costs, lack of learning skills, lack of confidence and motivation, inaccessibility to learning resources, hardware and software issues, lecture scheduling, lack of feedback, lack of contact with course-mates and faculty, alienation and isolation, lack of student support and services, and a lack of experience and/or training. A major benefit and importance of this research is the prospective possibilities in which student attrition rate at the undergraduate and postgraduate level can be reduced, in turn, increase the rate of retention and completion.
2. Literature Review
ODL is becoming more popular nowadays in the traditional university setting as most universities reform to face local and global changes in human resource (Santhi et al, 2005). The term “traditional” is used to describe full-time courses offered in higher education where lectures are held behind closed doors, where face-to-face lectures and tutorial sessions are delivered on a frequent basis with extensive use of teacher-directed teaching. ODL refers to education using learning resources, rather than attending face-to-face classroom sessions at a physical location, is the central feature of the learning experience (Commonwealth of Learning, 2003). In ODL, the learner is in charge of his/her own learning and self-development where courses are flexibly designed to meet individual requirements, and it also suggests a learner-centred philosophy (Ahmad, Philips, Santhi, Wahid, 2013). The major differences between traditional on-campus programmes and ODL programmes are the instructional modes being used to instruct students, the degree of maturation of the two learner groups, the physical location of the students, and the degree of responsibility placed on the two student groups. Attrition was investigated from the institutional point of view as well as learners’ interest, to reveal the real motives of learners when they decide to discontinue or delay their studies. OUM, specifically, embarks on reaching out to their learners who had quit or failed to re-register for the following semester and encourages them to continue their studies. This is done via telephone calls made to them by the Centre for Student Management. The learners are motivated to continue and agree to re-register and about 25% of them do re-register immediately. Some do at later semesters. Face-to-face academic advising sessions by Regional Learning Centre Directors are also arranged specifically for new learners. Other interventions include conducting workshops on Learning Skills, Assignment Preparation and Examination Preparation. Richard, Santhi & Rosli, (2012) note that learners are pleased to discuss their problems and challenges studying in an ODL environment with the university. A learner, who lacks enthusiasm or is not self-instructed, will find himself easily deterred from continuing his education. There is a need to find out who have developed almost similar typologies or classification to identify what barriers deter learners from continuing their studies.Situational and institutional are structural barriers, whereby the learners will find them beyond their control, as these barriers exist externally. Situational barriers includes lack of day care centres for the learners’ children, lack of transportation, lack of family support for learning, health problems, financial or legal difficulties, and personal or family problems, which may not be under their control (Belzer, 1998). Institutional barriers are matters such as scheduling of classes, locations of programmes, and institutional red tape that may discourage participation or retention. Institutional barrier had the widespread support of researchers through their use of this categorization (Rezabeck, 1999; Garland, 1993; Brindley, 1988; Brookfield, 1986; Charner & Frazer, 1986; Darkenwald & Valentine, 1985; Scanlan & Darkenwald, 1984). Dispositional deterrents describe barriers that are within the learner, such as fear of failure, unwillingness to try something new (Cross, 1981), lack of self confidence (Rezabeck, 1999), self-esteem and prior educational experience (Hubble, 2000). Quigley (1997) notes that dispositional barriers are the most significant for determining retention in any adult learning programmes. He adds that early identification of at-risk learners in a programme, with appropriate interventions, can significantly reduce drop-out rates and increase retention. In Darkenwald & Merriam’s (1982) study, the fourth deterrent was used: informational deterrent, arising from lack of information from faculty among learners regarding educational opportunities in the faculty and difficulty to accessing information from faculty staff. In this study, informational deterrent is excluded since all information is uploaded in MyVLE (My Virtual Learning Environment), the university’s Learning Management System, and updated from time to time, as well as easily accessible via internet.Thus, there are many deterrents to successful ODL – some might be new and many have plagued ODL since it was first conceived. Much literature too has been produced to explore student attrition in the higher education settings, which provides guidance as to possible factors that may influence attrition. Many factors have been considered to affect student attrition, and some of them are interrelated. Indeed, researchers view student departure as a process of interaction between individual students’ characteristics, the academic environment and the social environment (Santhi, 2010). These aspects, as well as other references are taken into consideration in the construction and execution of the questionnaire.
3. Methodology
This research utilizes the quantitative research methodology involving a sample of working adults who had quit or have not re-registered in both undergraduate and postgraduate programmes in OUM. In addition to examining who quits or do not re-register and why, the objective of this study is to examine which controllable and non-controllable factors are predictors of student attrition.The questionnaires were sent out to all the identified learners who quit from OUM beginning January 2006 Semester as well as learners who did not re-register since January 2009 Semester up till January 2011 Semester. Survey Monkey was used to post the online questionnaire. It was posted in 2011 for the respondents at https://www.surveymonkey.com/s/PGMWNTN. Emails were sent out to all names in list. Respondents were given 3 to 4 weeks to complete the online questionnaire. In the survey, respondents were requested to rate their responses to several statements based on the Likert-type scale of 1 to 5; with 1 (Strongly Disagree), 2 (Disagree), 3 (Neutral), 4 (Agree) and 5 (Strongly Agree). Higher scores indicate greater needs and greater deterrents. A total of 8251 learners who had quit or did not re-register (dormants) were requested via email to respond to the survey. A total of 340 (4.12%) responded. A total of 263 (2.92%) questionnaires were completed while 84 (1.03%) were partially filled. A total of 275 (3.33%) emails bounced back to senders. The survey sample covered all states in Malaysia.It was suspected that many from the population would not be accessing their OUM emails as well as their alternative emails any more since quitting or not re-registering in OUM. The Research Objective was:1. To identify factors (both controllable and uncontrollable factors) responsible for student attrition in these programmes.The Research Questions were:1. What non-controllable factors (e.g. demographic variables, educational background, employment characteristics, financial status, marital and family status, age, gender) are predictors of student attrition, etc?2. What controllable factors are predictors of student attrition: conflict between studies and work commitments or family commitments; negative emotions associated with studying, locus of control, initial reason for choice of course, level of competence/prior academic experience, management of course demands/workload, perceived need for academic support, sufficiency of background content knowledge for course, appropriateness of course, willingness to seek help for personal or academic problems, etc?
4. Instrumentation
This study integrates the Boshier’s (1982) Education Participation Scale (EPS) and Scanland & Darkenwald’s (1984) and Cross’s (1981) Deterrents to Participation Scale (DPS) as the basis of the research framework. EPS was originally created by Boshier (1971) and further developed by Morstain and Smart (1974), Boshier (1982), Boshier and Collins (1983), Boshier and Collins (1985), and used by Fujita-Starck (1996), Truell and Turner (1997) and others. Boshier’s EPS is applicable in a university setting, and its test-retest reliability and construct validity has been previously certified. The Deterrents to Participation Scale (DPS), developed by Scanlan and Darkenwald (1984) with reference to Cross (1981) and modified by Darkenwald and Valentine (1985), and used by Hansen (1999) and Rezabeck (1999) and others. These established scales have been tested and retested over and over again in countless other studies.
5. Results
5.1. Profile of Respondents
This section begins with a descriptive statistics on the profile of the respondents. The total number of respondents who completed the entire survey was 263. The highest qualification of the respondents upon entering into any programme at OUM was a diploma, consisting of 126 respondents (37.7%). The next highest qualification was from those respondents with SPM or equivalent, comprising some 116 respondents or about 34.7% of the total respondents. The first two groups of respondents formed the majority, i.e. 72.4% of the total. Holders of STPM or equivalent qualification made-up 12% of the total respondents, while the rest were respondents with a Bachelor degree, Master degrees or any other qualifications recognized by OUM.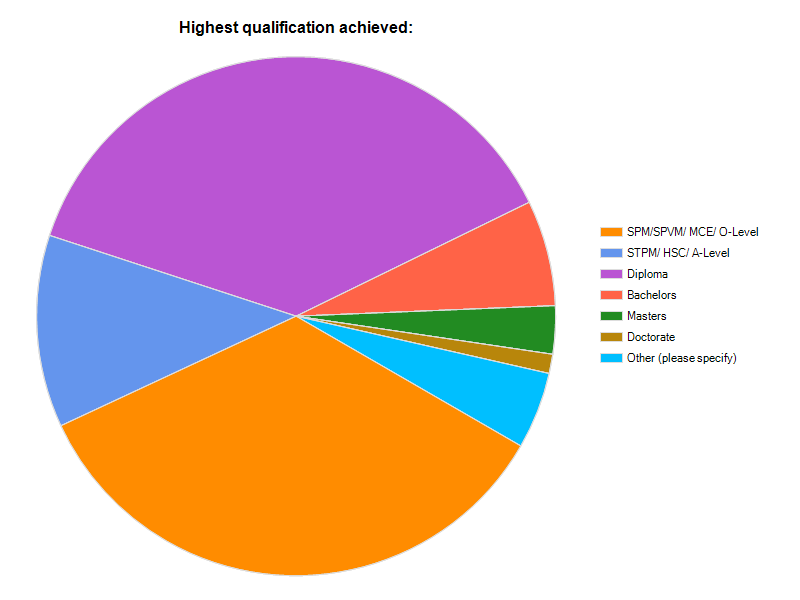 | Figure 1. Highest Qualification |
In terms of OUM programmes, a majority of the respondents were enrolled in the Bachelors programme at 77.2% (258), followed by Diploma at 15.6% (52), Masters at 4.8% (16), and PhD at 2.4% (8). For specific programmes, most of the respondents (63) were registered in the Bachelor of Management programme, followed by Bachelor of Business Administration, and Bachelor of IT. Others programmes include Bachelors in Multimedia Communication, Bachelor in Nursing Science, TESL, and Bachelors in Education.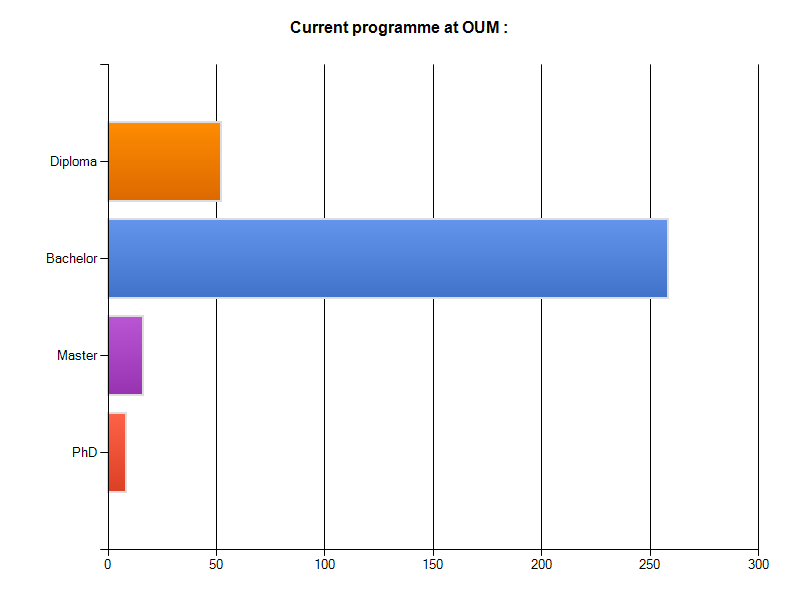 | Figure 2. Current programme at OUM |
The top three faculties based on the numbers of registered respondents were FBM at 27.3% (91), followed by FITMC at 25.4% (85), and FEL at 20.4% (68). The other respondents registered under FST at 13.2% (44), CGS at 7.5% (25), FASS at 3.6% (12) and the least was from the former SONAHS, now FONAHS, at 2.7% (9).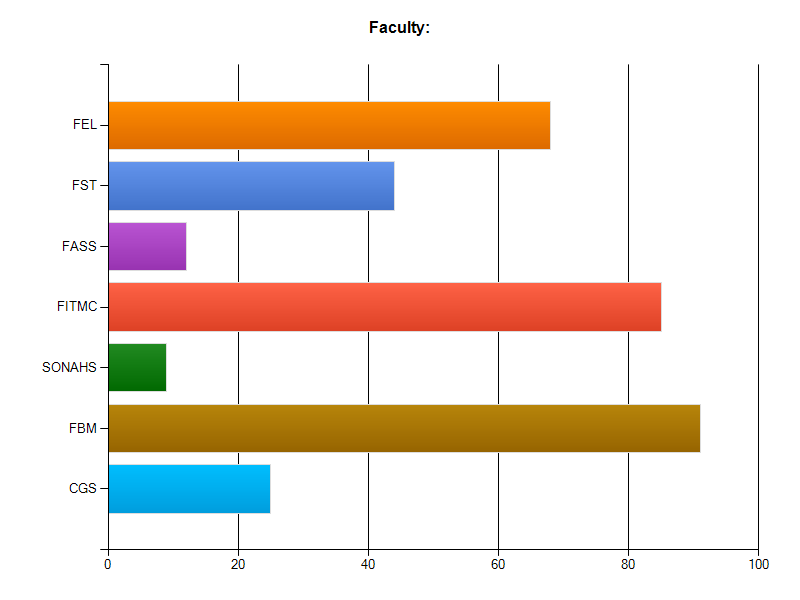 | Figure 3. Faculty |
In the study, the respondents were also asked their current status in the programmes they were registered in. About 47.2% (143) were dormant, while 27% (84) have officially quit, and 25.1% (76) were currently inactive.The respondents were also asked about their study plan. Interestingly, the finding shows that 62% (188) of the respondents plan to return to the programme, while 19.5% (59) were uncertain, and 18.5% (56) will not be returning to the programme.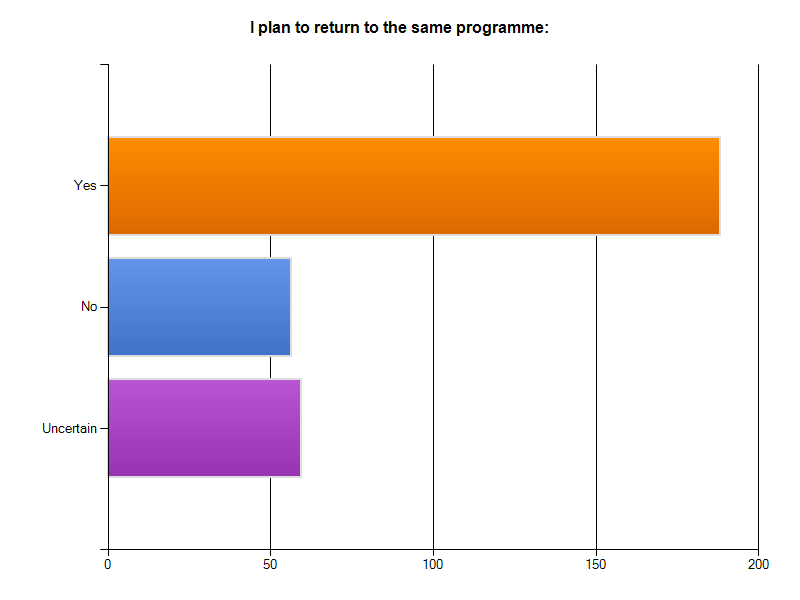 | Figure 4. Return to the programme |
Among those who planned to return, some of them indicated that they would be applying to undergo a different programme (36.8%). Most of them (41.1%), however, planned to continue with the same programme they were registered in. The other 22.2% were uncertain.
5.2. Factors Influencing the Rate of Attrition
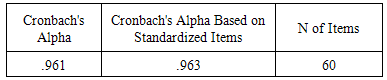
Factor analysis was used to identify important factors affecting the rate of attrition among OUM learners. The Cronbach's alpha, which measures the reliability of the instrument, was 0.961 (Table 1). This indicates that the instrument is highly reliable and therefore can be used further analysis.Table 1. Reliability Statistics
 |
| |
|
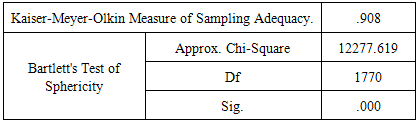
Apart from the reliability test, we also conducted two additional tests before proceeding with the Factor Analysis. The Kaiser-Meyer-Olkin Measure of Sampling Adequacy measure varies between 0 and 1, and values closer to 1 are better. In this study, the KMO has a value of 0.908, which is much higher than the suggested minimum value of 0.6. Hence, the sample is more than adequate to conduct the factor analysis. Result of the Bartlett's Test of Sphericity, which tests the null hypothesis that the correlation matrix is an identity matrix is highly significant; hence, we reject this null hypothesis. Taken together, both these tests have provided the minimum standard for us to proceed with the factor analysis.Table 2. KMO and Bartlett's Test
 |
| |
|
5.3. Factor Extraction
Eigenvalues associated with linear component (factor or variable) before extraction, after extraction and after rotation were listed. The eigenvalues associated with each factor represent the variance explained by that particular linear component. The first component, for instance, has an eigenvalue of 20.20; and this factor alone explains 33.667% of the total variance. It should be clear that the first few factor; explain relatively large amounts of variance (especially factor 1); whereas subsequent factors explain only small amounts of the total variance. Before extraction, there were 60 linear components within the data set. In this analysis, we chose to extract all factors with eigenvalues greater than 1. Hence after extraction, we obtained 13 factors. The interpretability of the extracted factors was further enhanced through rotation. Rotation optimizes the factor structure, where the relative importance of the 13 factors was equalized. In this case we use the varimax method of rotation. After extraction and rotation, Factor 1 explained 12.025% of the total variance, Factor 2 10.584%, and so on until Factor 13. Cumulatively, the 13 factors extracted explained 72.414% of the total variance.
6. Discussion
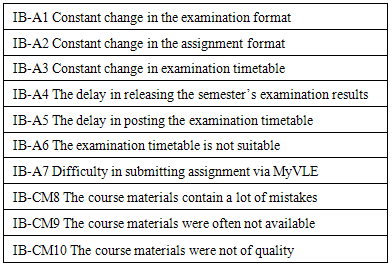
The factor loadings are represented in the rotated component matrix. These factor loadings are important in the interpretation of the factors. This is done by looking at the content of questions that load onto the same factor and identifying common themes. Assuming that the analysis represents some real world construct, then the common themes among highly loading questions can help us identify what the construct might be. The 13 factors extracted are discussed below.FACTOR 1: Institutional Barriers – Management of Assessment PracticesIn Table 3a, the questions that load highly on Factor 1 were mainly in the category called institutional barriers which are related to the management of assessment practices. The major issue appears to be the constant change in the assessment formats, both assignment and final examination. The learners also highlighted the delays in releasing examination results as well as posting of examination timetable. The difficulty of submitting assignment was also highlighted. Three questions about quality of course materials, which happen to be in the institutional barriers category, were also loaded onto this factor.Table 3a. Management of Assessment Practices
 |
| |
|
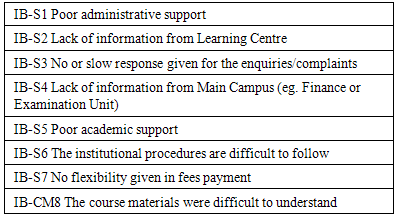
FACTOR 2: Institutional Barriers – Support ServicesThe second factor extracted from the analysis also originated from the institutional barriers category (Table 3b). This factor points out that the quality of support services did contribute significantly to the attrition/inactive rate among learners. Poor administrative and academic support, lack of information and slow responses to complaints were some of the reasons that lead to attrition or inactivity. Table 3b. Support Services
 |
| |
|
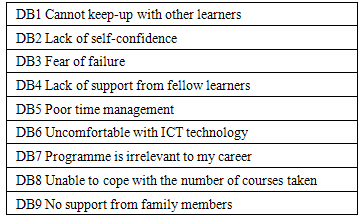
FACTOR 3: Dispositional Barriers – Leaner’s Capacity to StudyAs shown in Table 3c, the respondents, however, did admit that they also contributed to incidence of attrition or inactivity. This is categorised as dispositional barriers. This factor concerns with the inability of the learners to cope with their studies. They felt they could not keep up with their studies, particularly, when they compare their capability with those of their fellow learners. The lack of self-confidence and the fear of failure tend to lead them to drop out of the programme.Table 3c. Learner’s Capacity to Study
 |
| |
|
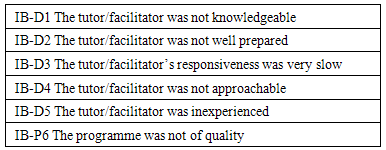
FACTOR 4: Institutional Barriers – Tutoring and FacilitatingThe fourth factor that contributed to the attrition/inactivity points back to the institutional barriers. The questions that load highly on this factor relate to the quality of persons involved directly in delivering the services to the learners (Table 3d). Not only the respondents felt that the tutors/facilitators lacked the proper knowledge, they also believed that the tutor/facilitators were not well-prepared, responded very slowly, not approachable and inexperienced. Table 3d. Delivery Practices – Tutoring and Facilitating
 |
| |
|
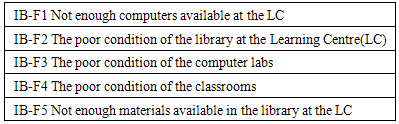
FACTOR 5: Institutional Barriers – FacilitiesAs can be gleaned from Table 3e, another institutional barrier that was extracted from the Factor Analysis centred on the questions regarding facilities. Availability of computing facilities, poor conditions of the library at learning centres, poor conditions of computer laboratory and classrooms were cited as reasons for attrition or inactivity. Table 3e. Facilities
 |
| |
|
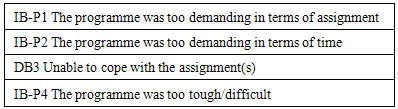
FACTOR 6: Institutional Barriers – Programmes’ IntensityTable 3f shows yet another institutional barrier that contributed to attrition and inactivity. The learners who were dormant or inactive felt that the programmes were too tough for them; perhaps tougher than what they expected before enrolling into the programmes. They felt that the assignments were too demanding and too time-consuming. Table 3f. Programmes’ Intensity
 |
| |
|
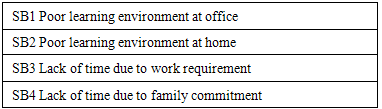
FACTOR 7: Situational Barriers – Learning Environment and Time ManagementQuestions reflecting situational barriers were highly loaded to Factor 7 (Table 3g). The respondent believed that the environment at the office and at home was not conducive for learning. As expected, work requirement and family commitment consumed most of their time.Table 3g. Learning environment and time management
 |
| |
|
The seven factors above explained 54.336% of the total variance, whereas the next six factors as listed below, explained 18.078%. The factors that may explain why learners decided to remain dormant or inactive include health problem, transportation and location of learning centres, financial problems, timetabling of tutorial and seminar, and accessibility of the learning management system. FACTOR 8: Dispositional Barriers – Health Problem FACTOR 9: Situational Barriers – Transportation and Location
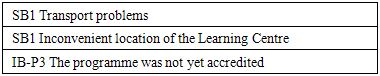 FACTOR 10: Situational Barriers – Financial ProblemFACTOR 11: Dispositional Barriers – Tight Schedule
 FACTOR 12: Institutional Barriers – Timetable
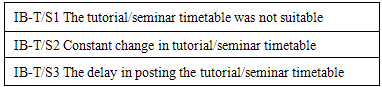 FACTOR 13: Institutional Barriers – myVLEIn the above analysis, we retained the factors which have eigenvalues of more than one. Thirteen factors were retained. Another rule of thumb regarding the number of factors to be retained is to look at the scree plot, as shown in Appendix 3. Using the scree plot, we may retain all factors before the breaking point or elbow. This curve is a bit difficult to interpret because the curve begins to tail off after five factors, but there is another drop after six factors before a plateau is reached. We could justify retaining either four or six factors.
7. Conclusions
This research was carried out to find out why many students drop out of online and distance learning programmes inspite of the various measures and strategies taken by an ODL institution like OUM to increase their learners retention rate. The research findings focuses on identifying key factors that tend to have an influence on the attrition rate. The findings of this study concludes that the major factors leading to ODL learners’ attrition or inactivity were mainly due to institutional barriers; these include the institution’s management of assessment practices, the quality of support services and the ability of the tutors and facilitators to deliver effectively. On the part of the learners, the main factor was their capacity to cope with the programmes’ requirement. Improving the attrition rate would require more discipline by the learners and more effort by the institutions’ academic and administrative staff, more than the traditional academic institutions.
ACKNOWLEDGEMENTS
This research was supported by Grant No. URI-GR-2010-012 from The Institute of Quality, Research & Innovation, Open University Malaysia, Kuala Lumpur.
References
| [1] | Ahmad Hj. Mohamad, John Arul Philips, Santhi Raghavan, Wahid Razzaly. 2013, Code of Practice For Open and Distance Learning - Kod Amalan Pembelajaran Terbuka dan Jarak Jauh (dual-language). Malaysian Qualifications Agency: Petaling Jaya. |
| [2] | Belzer, A. (1998). Stopping Out, Not Dropping Out. Focus on Basics. Cambridge, MA: Harvard. |
| [3] | Brindley, J.E. (1985). Completion and attrition in distance education: The learner's perspective. Paper presented at the 13th annual International Council for Distance Education World Conference, Melbourne. |
| [4] | Brindley, J. E. (1988). A model of attrition for distance education, In J. S. Daniel & D. Stewart, Developing Distance Education (pp.131 -137). Oslo, Norway: International Council for Distance Education. |
| [5] | Brookfield, S.D. (1986). Understanding and Facilitating Adult Learning: A Comprehensive Analysis of Principles and Effective Practices. San Francisco: Jossey-Bass. |
| [6] | Burns, L. (2001). When Mothers Become students: Impact on Children and the Family System. Alliance/ACE Conference Proceedings, Austin, Texas. |
| [7] | Charner, I., & Fraser, B. (1986). Different strokes for different folks: Access and barriers to adult education and training. Washington, D. C.: National Institute for Work and Learning. |
| [8] | Cross, K. P. (1981). Adults as Learners: Increasing Participation and Facilitating Learning. San Francisco, CA: Jossey-Bass, Inc. |
| [9] | Darkenwald, G. G., & Merriam, S. (1982). Adult education: Foundations of practice. New York: Harper & Row. |
| [10] | Darkenwald, G.G & Valentine, T. (1985) Factor structure of deterrents to public participation in adult education. Adult Education Quarterly. 35. 177 - 193. |
| [11] | Garland, M. (1993). Student perceptions of the situational, institutional, dispositional and epistemological barriers to persistence. Distance Education 14 (2): 181–98. |
| [12] | Hansen, M.F. (1999). Deterrents to Participation in Educational Activities by Michigan Farmers. Ph. D Thesis. Michigan State University |
| [13] | Hubble, J. (2000). Intake Procedures as a Factor in Identifying Addressing Barriers of Adult Education Students. Southwest Texas University. (ERIC Document Reproduction Service No. Ed. 443982). |
| [14] | Parker, A. (1995). Distance education attrition. International Journal of Educational Telecommunications, 1(4), 389–406. |
| [15] | Quigley, B. A. (1997). Rethinking literacy education: The critical need for practice-based change. San Francisco: Jossey-Bass. |
| [16] | Rezabek, R. (1999). Barriers to distance education enrollment. Presented at TeleLearning Conference. October. Austin, TX. |
| [17] | Richard Ng, Santhi Raghavan & Rosli Hamir, 2012. Supporting New ODL Learners via Face-to-Face Academic Advising to Increase Retention: Sharing Open University Malaysia’s Experience. Asian Association of Open Universities Annual Conference 2012, 16-18 October, Chiba, Japan |
| [18] | Santhi Raghavan, Shamsuddin Ahmad, Bahaman Abu Samah & Azizan Asmuni. (2005). What Turns Malaysian Workforce On to Open and Distance Education: Research Describing Needs to Participate. National Conference on HRD: HRD Practices and Directions for A Developed Malaysia, Putrajaya, Malaysia. |
| [19] | Santhi Raghavan. (2009). Malaysian Workforce And Open & Distance Education: Deterrents Affecting Needs To Participate. Paper presented at The Asian Conference on Education 2009, Osaka, Japan. |
| [20] | Santhi Raghavan. 2010. Learner Attrition and Retention at OUM: The Big Picture. Tutor Connexxions, Issue 30 September 2010. Open University Malaysia Publication: Kuala Lumpur. |
| [21] | Scanlan, C.L and Darkenwald, G.G. (1984). Identifying deterrents to participations in continuing education. Adult Education Quarterly. 34, 155-166. |
| [22] | The Commonwealth of Learning (2003). Tutoring in Open and Distance Learning: A Handbook for Tutors. Vancouver, Canada. |
 Abstract
 Reference
 Full-Text PDF
 Full-text HTML