-
Paper Information
- Next Paper
- Previous Paper
- Paper Submission
-
Journal Information
- About This Journal
- Editorial Board
- Current Issue
- Archive
- Author Guidelines
- Contact Us
American Journal of Economics
p-ISSN: 2166-4951 e-ISSN: 2166-496X
2015; 5(2): 194-199
doi:10.5923/c.economics.201501.24
Creativity and Innovation (Organizational Factor) Influence on Firm Performance: An Empirical Study on Malaysian Telecommunication Mobile Network Operators
 Abstract
 Reference
 Full-Text PDF
 Full-text HTML
Thiaku Ramalingam1, Jeannot Abdul Karim2, Shishi Piaralal2, Baldev Singh2
1Operation & Maintenance, Asian Broadcasting Network
2OUM Business School, Open University Malaysia
Correspondence to: Thiaku Ramalingam, Operation & Maintenance, Asian Broadcasting Network.
| Email: |  |
Copyright © 2015 Scientific & Academic Publishing. All Rights Reserved.
Creativity and innovation has become an essential to any organization that wish to sustain their competitive advantage in today’s world that has higher growth of new knowledge, ideas and accelerated rate of globalization. It is safe to say that creating a knowledge based organization which actually dependent on the degree of creative and innovative characteristics will determine the success and survival of the company in the long run. Even though some organizations may have already attempted to encourage creativity and innovation by promoting human capital development, the extent may have been limited due to other influencing factors. This research attempts to understand the influence of creativity and innovation to drive organizational performance among Malaysian telecommunication mobile network operators.
Keywords: Creativity, Innovation, Firm Performance, Telecommunication
Cite this paper: Thiaku Ramalingam, Jeannot Abdul Karim, Shishi Piaralal, Baldev Singh, Creativity and Innovation (Organizational Factor) Influence on Firm Performance: An Empirical Study on Malaysian Telecommunication Mobile Network Operators, American Journal of Economics, Vol. 5 No. 2, 2015, pp. 194-199. doi: 10.5923/c.economics.201501.24.
Article Outline
1. Introduction
- Creativity and innovation has become an essential to any organization that wish to sustain their competitive advantage in today’s world that has higher growth of new knowledge, ideas and accelerated rate of globalization [1]. It is safe to say that creating a knowledge based organization which actually dependent on the degree of creative and innovative characteristics will determine the success and survival of the company in the long run. Even though some organizations may have already attempted to encourage creativity and innovation by promoting human capital development, the extent may have been limited due to other influencing factors [2]. Consequently, it raises the awareness to outline the determinants that supports or hinders an organizations’ attempt to be creative and innovative which will then make it possible in developing appropriate organization model to achieve success depicted by the company’s vision and mission. According to [2], creativity and innovation and its relationship can be summarized as two phases of creative process which overlaps each other. The concept adapted from the scholar is also found to be in line with other similar studies as well. For example, taking risks in generating new ideas and individual ability to create new ideas constitute the meaning of creativity and should be tolerable [3]. Implementing an idea of new product or service is part of being innovative. These ideas can include cost saving approaches, new processes to help production and other improvement activities [4]. To conclude, creative activities of generating new ideas, product and services can be innovative based on the time the notions are implemented as part of the effort to change [5]. Therefore, the understanding of creativity and innovation based on organizational factor was adapted into this research content.Malaysia has experienced notable changes in the telecommunication industry in recent years especially in the cellular services market as growing trend of subscribers moving towards advanced information and communication technology [6]. Mobile services received high demand from consumers resulting to subscriber base increase to 20 million in 2006 compared to only 3 million in 1999 with continuous growing tendency. The trend of internet subscribers was also encouraging with 5 million in 2006 in comparison with close to 2.9 million 2 years before. According to [7], telecommunication firms in Malaysia must understand the global changes in organization practice such as knowledge management and play a more proactive approach in turning Malaysian economy towards knowledge based economy. Achieving strategic competitive advantage by having skilful human resources potentials are vital for companies to survive in the competitive landscape [8]. Previous researches have revealed that innovation and creativity has a positive impact on organization performance ([9-11]). Consequently, these researches allowed other similar studies to make use innovation factor as an independent variable to assess organization level achievements ([12-15]). Organizational performance are often measured based on manager’s perception and such approach is acceptable to determine the extent of creativity and innovation as well [16]. This study however is limited to telecommunication industry. An efficient delivery of telecommunication services can generate various advantages towards economic growth ([17-19]).
2. Research Methodology
- The theoretical framework in this research was adapted from the study of [2] and used to determine organizational factors that facilitate and influence creativity and innovation in Malaysian Mobile Telecommunication firms. Meanwhile, all the variables that influence creativity and innovation to drive organization performance based in different aspect of assessments were adopted from the research by [20] to develop a new study framework. Finally, following hypotheses were developed based on the new research framework:H1 – There is a positive relationship between organization strategy and firm
 performance.H2 - There is a positive relationship between organization support mechanism
  and firm performance.H3 - There is a positive relationship between organization structure and firm
  performance.H4 - There is a positive relationship between organization behavior and firm
  performance.H5 - There is a relationship between independent variables (Strategy, Support
  Mechanism, Structure and Behavior) of creativity and innovation and
  dependent variable (firm performance).
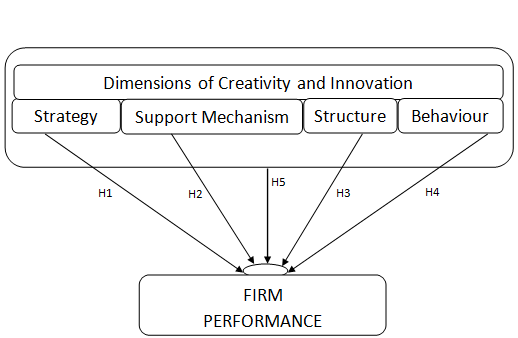 | Figure 1. Theoretical Framework |
3. Data Analysis and Finding
3.1. Demographic
- Evidently, the sample represents higher number of respondents in the middle age group of 31-44 (67 or 65.1%). Similarly, higher number of males (75 or 68.8 percent) compared to females (34 or 31.2 percent) contributed in the survey. Pertaining to academic qualification, majority of respondents’ qualification were degree and higher (81.7 percent), followed by Diploma (15.6 percent) and the least number of them were having professional certificate (2.8 percent). This finding implies that most of the respondents who have participated in the survey have a high level of education and belong to middle age group.Majority of the respondents are from the executive group (77 or 70.6 percent) followed by participation from managers (16 or 14.7 percent). Senior Managers and Team leaders have least number of participation (8 or 7.3 percent) respectively. Statistics show that employees with more than 5 years of working experience contributed to highest number of surveys (56 or 51.4%), secondly by those with more than 10 years of experience (19 or 17.4%). Less than 10 years and more than 5 years contributed the least survey participation (10 or 9.2 percent). There were considerable amount of new joiners who have less than 1 year experience provided the survey feedback (24 or 22 percent). On the attachment with the department within the organization, majority of the samples were received from employees who serve more than 10 years (40 or 36.7 percent). Less than 5 years of experience (but more than 1year) contributed to second highest group (33 or 30.3 percent), followed by less than 1 year (18 or 16.5 percent) and lastly less than 10 years (18 or 16.5 percent). This finding implies that most of the respondents in who participated in the survey belong to the working level and not management with higher number of working experience in the organization and moderate number of service in current department.Participation from employees of Maxis is the highest (40 or 36.7 percent) followed closely by Digi (38 or 34.9 percent) and lastly by Celcom (19 or 17.4 %) and UMobile (12 or 11 percent). Majority of the sample came from the Operations department (73 or 67 percent) and Project (20 or 18.3 percent). Other departments have lesser contribution.Majority of the respondents who participated in the survey do not hold management positions. In fact, higher percentage of samples was recorded from the executive level. Analyzing the working experience, it is found that majority of the participants have been with the same department after joining the organization. To add, those with more than 10 years of experience in the organization were found to be attached to the same and current department during the survey.
3.2. Reliability Test
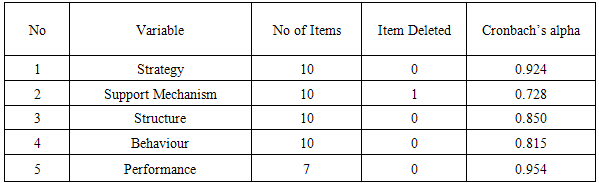
- Generally, the test results showed that both the items and variables were reliable. 1 item was omitted. Q27 from the independent variable of support mechanism was omitted in the study in order to improve the reliability of the instrument. The question belonged to one of the reverse coded question and may be difficult to be understood clearly by the respondents. It is to be noted that the result of Cronbach Alpha of this study for independent variables (Strategy, Structure, Support Mechanism and Behaviour) were higher than that of previous research in which the questionnaire was adapted from; proving the increased reliability factor in this paper. Additionally, all the results were found to exceed value of 0.7 to indicate high reliability of the instruments used [21]. Thus, this result permits the researcher to conduct Pearson correlation analysis before further statistical tests.
|
3.3. Correlation Analysis
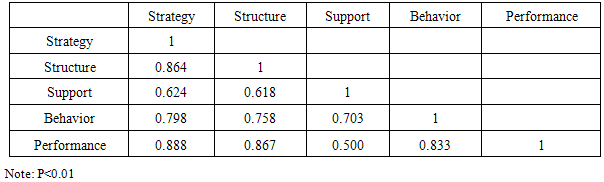
- The results of the correlation analysis proved that there is existence of the correlation between dependent and independent variables. All the variables had shown positive relationship between one another. Independent variable, Strategy (r=0.888) had strongest relationship to dependent variable, performance. Closely followed by the organizational factors of structure (r=0.867) and behaviour (r=0.833). Support (r=0.500) variable had weaker positive relationship with performance. All the above relationships were significant at 0.01.
|
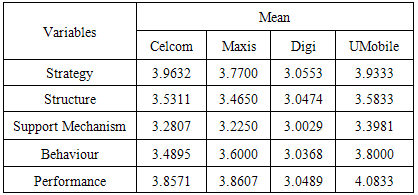
3.4. Descriptive Statistics of Variables
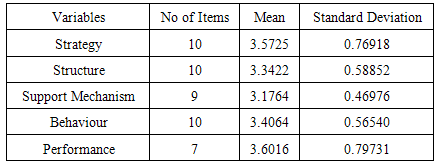
- Apparently, the mean scores for all variables were above 3.1. The close mean score with each variable indicated that each construct are closely related and warrant further statistical testing to understand how these construct are related to each other. The standard deviations for all variables seemed to fall between the range of 0.46976 to 0.7973 which simply reflect the existence of considerably small variability within the data set. The variation value further indicates that all answers obtained thru the survey were not much different from one respondent to another, thus signifies the existence of much smaller variances in responses received.
|
|
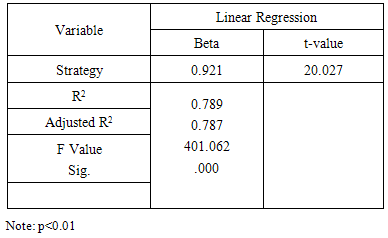
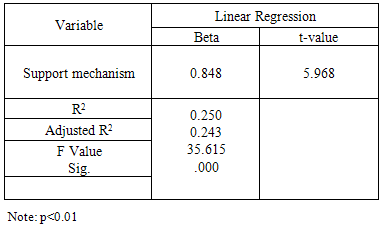
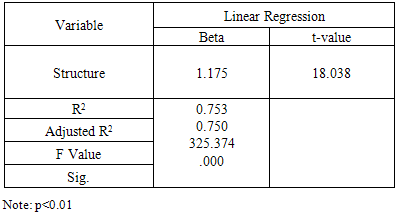
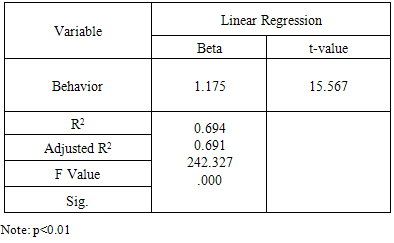
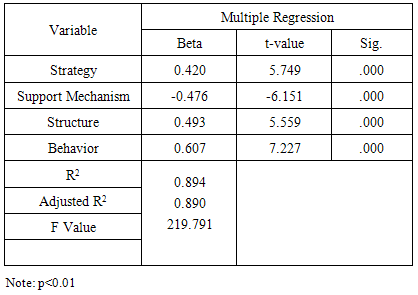
3.5. Regression Analysis
|
|
|
|
|
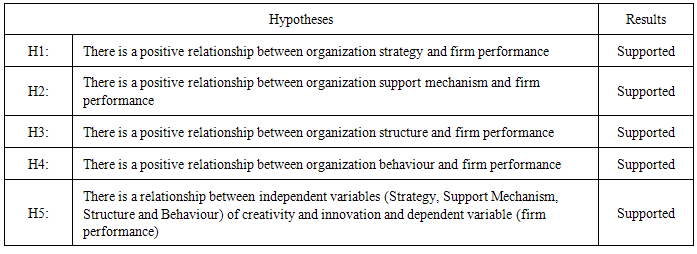
3.6. Summary
- Total of 5 hypotheses been tested. All of them were supported.
|
4. Discussion and Conclusions
- Based on the research results, it is found that the strategy factor plays most significant effect on the organization performance followed by structure and behaviour. Meanwhile, support mechanism although proved to be asserting positive relationship towards firm performance, has lesser influence in comparison with other factors of creativity and innovations such as strategy, structure and behaviour. Nevertheless, it should be noted that the research have answered the perception of working level employees in these organization that may not have deep understanding of the nature of creativity and innovation especially on support mechanism elements which could be less transparent in the company. On a positive note, employees with vast experience in the organization in terms of tenure years contributed much on highlighting the aspects of creativity and innovation as seen by them practiced in the company. The lack of perceived support mechanism to help boost company performance denotes that these organization under study still lack on providing the necessary incentives and other benefits to allow the growth of creative efforts or the current setup unable to satisfy the requirement of the employees and these efforts may not be generally socialized. As depicted by the research framework, supporting factors such allowing employees to work on special projects during normal working hours can be beneficial in developing the innovative thinking among the staffs that will facilitate in improving the business and operational performance of the company. There is a strong influence of structure factor in the organization that translates into increasing the performance factors of the company such as profitability, market share and growth thru creativity and innovation as the catalyst. The results are congruent to previous research ([9], [10]). The result of the study is supported by the fact that mobile network operators in Malaysia practiced a much flatter organization that emphasized on team work. As a matter of fact, there are also more open approach on introducing western organization culture such flexible working hours and open door concepts to allow competitiveness in recent years.The research objectives had been met to understand the influence of creativity and innovation and its relationship towards firm performance. This research paper has provided an empirical test for the adapted theoretical framework and the findings indicate strong support for their conceptualization of innovation and creativity as an emergent property of organizations facilitated its various factors. The framework holds considerable promise for further research and for guiding management initiatives aimed at stimulating innovation and creativity as part of the organization factor that will drive firm performance especially in service organizations such as telecommunication. However similar to other academic research, generalization of the results toward other industries needs to be validated with further research. Additionally it is a sampling method used in this study is convenience method and for future research it is suggested a more representative probability sampling method to be used. In the context of mobile network operators, it is vital for each organization to adapt the finding of this study that indicate strong support on conceptualization of innovation and creativity as an emergent property of organizations that will have positive outcome on firm performance. Indeed the new developed framework holds considerable promise for further research and for guiding organizations’ management initiatives aimed at stimulating innovation.