Saari Ahmad1, Mustakim Melan2, Mustafa Zakaria1
1School of Business Management University Utara Malaysia
2School of Technological Management and Logistics University Utara Malaysia
Correspondence to: Saari Ahmad, School of Business Management University Utara Malaysia.
| Email: |  |
Copyright © 2015 Scientific & Academic Publishing. All Rights Reserved.
Abstract
This article explore the issues and barriers to the growth of haulage industry in Malaysia. The objectives of this article are to identify issues and barrier to sustainable growth of haulage industry in Malaysia. The review of literature in haulage industry reveals that not many studies conducted to examine the issues and barriers to a sustainable growth of haulage industry in Malaysia. Secondary data was used to identify issues and barriers for a sustainable growth of Malaysian haulage industries. Issues identified are high and heavy vehicle volume which result in congestion and pollution, poor urban logistics and infrastructure, lack of inter-modal choice, unhealthy competition, poor logistics infrastructure, under usage of ICT in logistics and pollution. The barriers to enter the industry are capital intensive, economics of scale, low profit margins for small and medium operator, distance of the depots from the port and inefficiency in material handling.
Keywords:
Issues, Barriers to sustainable growth in haulage industry
Cite this paper: Saari Ahmad, Mustakim Melan, Mustafa Zakaria, Issues and Barriers to Sustainable Growth of Malaysian Haulage Industry, American Journal of Economics, Vol. 5 No. 2, 2015, pp. 82-89. doi: 10.5923/c.economics.201501.06.
1. Introduction
Globalizations have created many opportunities for businesses in the ASEAN regions to prosper in line with the economic growth in the region. As a result of globalization ASEAN will be a single market by 2015. [1], [14]. The ASEAN countries will be experiencing free flow of goods and services, investment, and skilled labor and freer flow of capital among the ASEAN members. Globalization and the effect of internationalization has change Malaysia to be one of the important commercial hub in the Asia-Pacific region. The effect of Economic Transformation Program (ETP) and the Government Transformation Program (GTP) has increased the trading volume and activities in the domestic market and international market as well. Consequently the increased in the logistics and haulage activities in the domestic market and international market as well. [1], [11]. The Malaysian government provides export incentives to qualified exporter, has resulted in the sustainable growth for volume of export. Consequently the demand for the hauler business and ocean cargo will increase continuously and dominate the volume of tonnages shipped to and from Malaysia. Airborne cargo is continuously growing in volume and values, although it is comparatively much more expensive compared to sea transport.
1.1. Literature
Developing countries in East Asia Pacific will see slightly slower economic growth in 2014 but the pace of growth in the region will pick up next year excluding China. The growth is caused by gradual recovery in high-income economies boosts demand for exports from the region. [1] [11]. The report revised the World Bank’s 2014 forecast for Malaysia to 5.7%, up from 4.9% in April as a result of robust export in the first half of the year. Besides that Malaysia was left far behind by its neighbor the world’s best port, Singapore in logistics business. Logistics, energy, postal services and telecommunications have not always been as open to competition as they are today. By opening up these markets to international competition, consumers can now choose from a number of alternative service providers and products.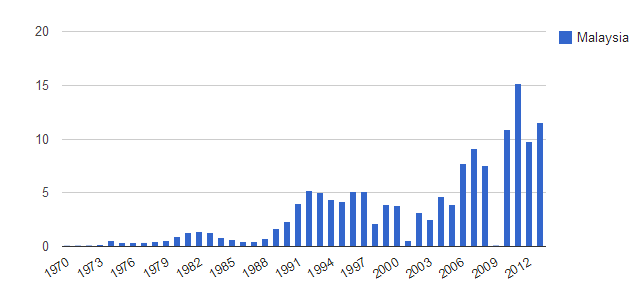 | Figure 1. Malaysian Foreign Direct investment. Source: World Bank Report 2014 |
Figure 1 illustrate the foreign direct investment in Malaysia from 1970 to 2012. It clearly shows that it is on the upward trend in 2013. The World Bank provides data for Malaysia from 1970 to 2013. The average value for Malaysia during that period was 3.28 billion U.S. dollars with a minimum of 0.09 billion U.S. dollars in 1970 and a maximum of 11.58 billion U.S. dollars in 2013.The Malaysian government should look into improvement of current legislations in international conventions involving shipping, liability regimes, air and surface transport, to strengthen our governance, regulatory functions and ensure international compliance. The decisions to allow competitors to use the same facilities or, alternatively, to construct new facilities near the existing port has aroused tensions among the existing logistics operators as well as the haulers. In the railway, electricity and gas industries, the network operators are now required to give competitors fair access to their networks. In these industries, monitoring fair network access by all suppliers is essential to allow the consumer to choose the supplier offering the best conditions. Opening up new markets requires additional regulation to ensure that public services continue to be efficiently provided and the consumer is not adversely affected.
1.2. Definition of Haulage Industry
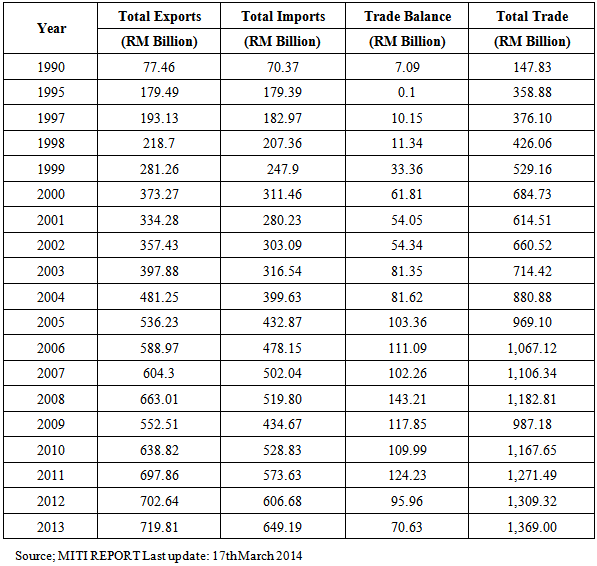
Haulage generally refers to the business of being a hauler (UK English) or hauler (US English), also called haulage contractor, common carrier, contract carrier, or private carrier or transporting goods by road or rail for other companies or one’s own company [2], [17]. It includes the horizontal transport of ore, coal, supplies, and waste, also called cartage or drayage. The vertical transport of the same with cranes is called hoisting. [2], [17] Haulage fees, sometimes also simply called “haulage”, include the charges made for hauling freight on carts, drays, lorries, or trucks, and is incorporated for example in the cost of loading raw ore at a mine site and transporting it to a processing plant. [2] Malaysia’s international trade experienced tremendous growth throughout the last 3 decades and it plays a large role in Malaysian economy. In 2013, Malaysia post a trade balance of RM70.63 billion. The highest was recorded prior to global recession in 2008 at RM143.21 billion. Table 1 shows statistical figures on total export, import and trade balance since 1990.Table 1. Statistical figures on total export, import and trade balance since 1990
 |
| |
|
1.3. Malaysia International Trade Activities
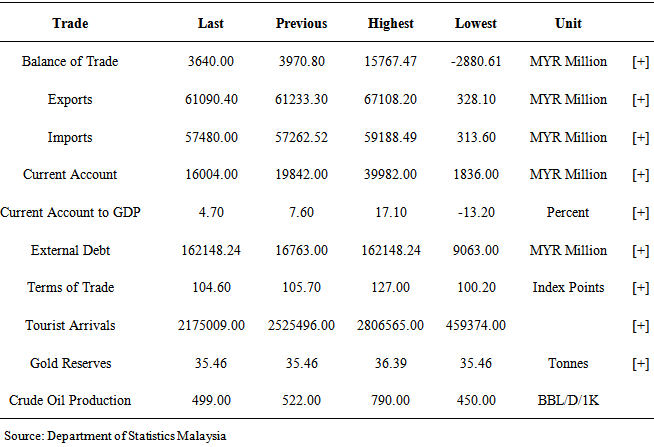
Table 1 illustrates that Malaysia posted a 2.38 % growth in export in 2013 compared with 2012. Whereas grow by 6.54 % in 2013 compare with 2012. However the balance of trade shows a deficits from RM 95.96 in 2012 to RM 70.63in 2013 which deficit for 26%. However the balance of trade in 2012 was RM 1302.32 Trillion and in 2013 RM1369 Trillion. [4-6].The international trade increased by 4.6% in 2013 compared with 2012. Malaysia trade surplus widened to MYR 3.64 billion in July of 2014 from MYR 2.85 billion a year earlier, mainly driven by stronger demand for petroleum. In July of 2014, exports rose 0.6 percent year-on year to MYR 61.12 billion from MYR 60.73 billion a year earlier. Sales of petroleum products, accounting for about 10.9 percent of total shipments, rose 29.3 percent to MYR 6.64 billion. Exports of palm oil, accounting for 6.6 percent, rose at a faster 10.9 percent to MYR 4.05 billion, while overseas shipments for liquified natural gas declined 22.9 percent to MYR 4.05 billion due to lower exports volume. [4], [5], [6] .Exports to the United States grew 4.5 percent in July to MYR 5.08 billion due to higher sales of E&E products, optical and scientific as well as chemicals and chemical products, slowing from a 9.5 percent increase in the previous month. Sales to the Southeast Asia countries rose 1.7 percent to MYR 17.81 billion from a 9.6 percent increase in June [4-6].Exports to the European Union expanded by 8.9 percent to MYR 5.98 billion froma3.9 percent increase in the previous month. Outward shipments to Japan contracted the most by 22.1 percent to MYR 5.56 billion, mainly due to lower exports of LNG and crude petroleum compared to a 2.6 percent contraction in June. In the month of June 2014, the country registered MYR3.97billion trade surplus. Imports decreased by 0.7 percent to MYR 57.48 billion after registering a 9.2 percent increase in June. Purchases of capital goods, accounting for 12.8 percent of total imports, declined 17.9 percent to MYR 7.35 billion. Those of consumption goods also fell 9 percent to MYR 4.19 billion while intermediate goods, accounting for 60.2 percent, increased by 2.6 percent to MYR 34.62billion. In June of 2014, the country registered a MYR 3.97 billion trade surplus.Figure 2 illustrate the Malaysian balance of trade performance from October 2013 to July 2014 International trade plays a large role in Malaysian economy. Since 1998, Malaysia reports consistent trade surpluses. Main exports are: electrical and electronics products (35% of total exports), palm oil (15 percent), petroleum products (9 percent), liquefied natural gas (7 percent), timber and natural rubber. Malaysia also sends abroad chemicals, machinery, appliances and manufactures metals. [4-6]. Table 2 illustrate clearly on the Malaysia current account to GDP which shows 4.7. Whereas current account stood at 16004. External debt was recorded as 162148.24 which shows a reduction of 8.7%. Total export exceeds total import by 3610.4. Gold reserves maintain at 35.46. However crude oil production has reduces to 499 from 522 in the previous year [4].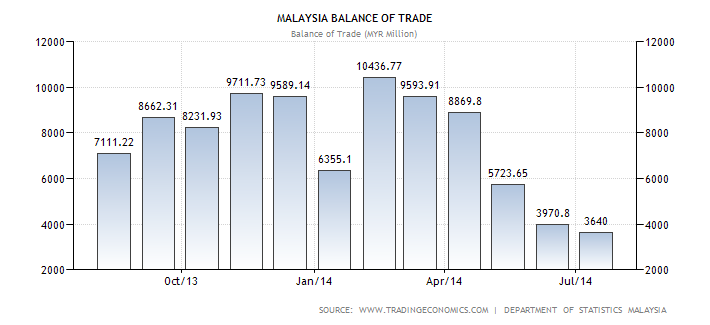 | Figure 2. Malaysia Balance of trade 2014. Source: Department of Statistics Malaysia |
Table 2. Malaysian Trade performance
 |
| |
|
Figure 3 illustrates major export item based on comparison between export performance of 2013 and 2014. Electrical and electronic goods remain the highest contributor to the nation’s export, followed by other products, petroleum and petroleum by product. Besides that Chemical product, palm oil and rubber products contributed a substantial percentage to the nation export. [5]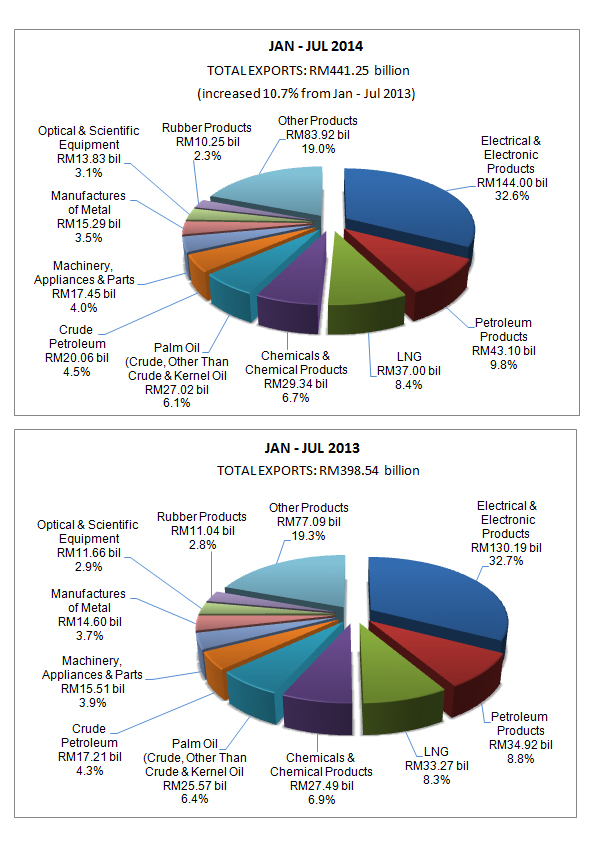 | Figure 3. Major Export Comparison for 2013 and 2014. Source: Department of Statistics Malaysia |
Figure 4 illustrates major import item based on comparison between import performance of 2013 and 2014. Electrical and electronic products goods remain the highest contributor to the nation’s import, followed by other products, petroleum and petroleum by product. Besides that Chemical product, palm oil and rubber products contributed a substantial percentage to the nation import. The country’s main imports are: machinery and transport equipment (60 percent of total imports), manufactured goods (12 percent), fuel (10 percent) and chemicals (9 percent).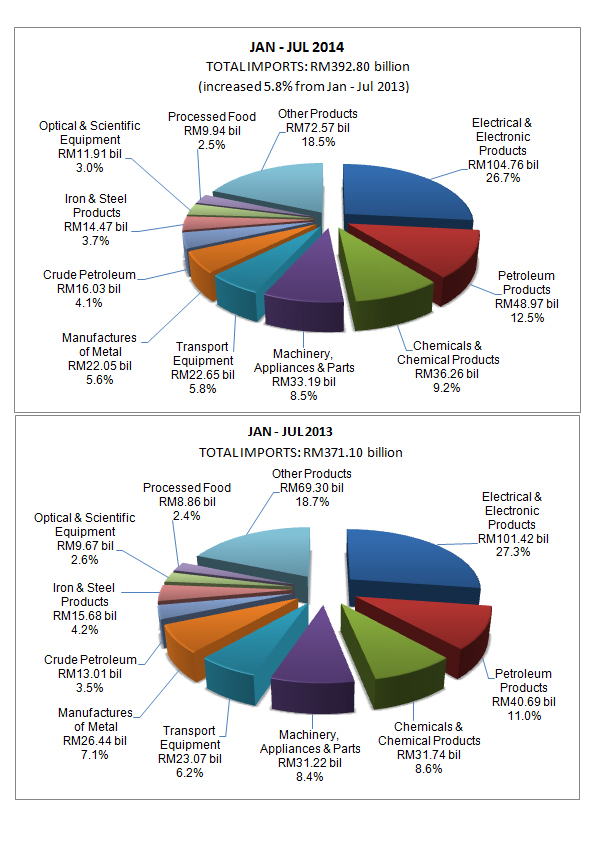 | Figure 4. Major Import Comparison of 2013 and 2014. Source: Department of Statistics Malaysia |
Main trading partners are: Singapore (15 percent of total exports and 13 percent of imports) and China (13 percent of exports and 15 percent of imports). Others include: Japan, United States and European Union. This page provides - Malaysia Balance of Trade - actual values, historical data, forecast, chart, statistics, economic calendar and news. Content for - Malaysia Balance of Trade - was last refreshed on Sunday, September 28, 2014. [5] Figure 5 illustrates the total export percentages by sectors. Majority of the export are from manufactured goods which is 76.4%. Followed by mining goods 13.8%, agricultural goods 9.1% and Others 0.7%. [6].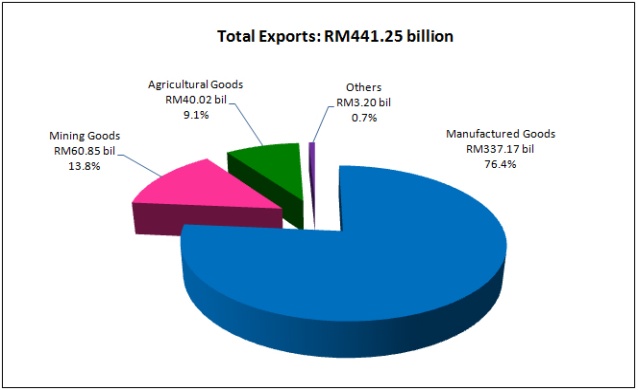 | Figure 5. Total Export by Sectors. Source: Department of Statistics Malaysia |
Figure 6 illustrates clearly the year to year growth trend of the main sectors that is manufactured goods, mining goods and agricultural goods. It clearly indicates that the growth of the three main sectors are associated to each other based on year on year trend. 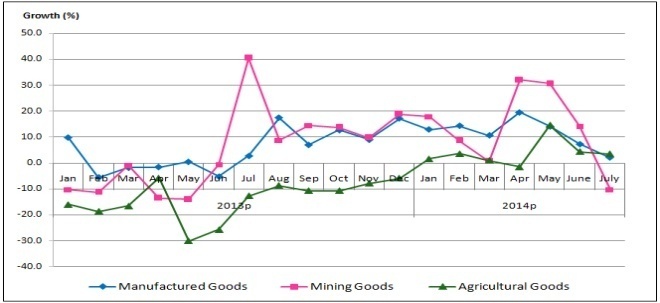 | Figure 6. Year-on-Year Export Growth Trend of Main Sectors, 2014. Source: Department of Statistics Malaysia |
Figure 7 illustrate the month to month movement of export for agricultural goods, mining goods and Manufactured goods. It clearly shows that manufactured goods are proportionately related to the export of agricultural goods and mining goods.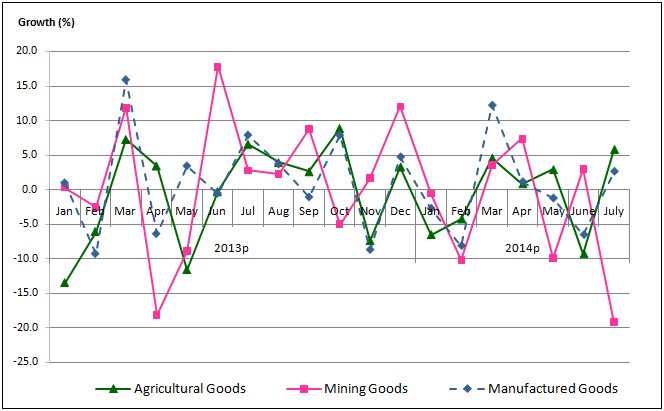 | Figure 7. Month-on-Month Export Growth Trend of Main Sectors, 2014. Source: Department of Statistics Malaysia |
Figure 8 illustrate the World Port Ranking in Container traffic in 2008. Malaysian Ports Port Tanjung Pelepas, Port Klang are among the International Ports in Asia which was rank in order of its traffic container. 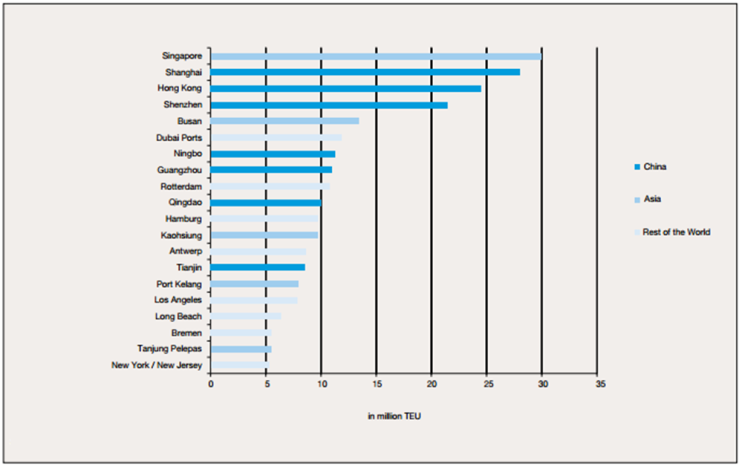 | Figure 8. World Port Ranking in Container traffic in 2008. Source: Institute of Shipping Economics and logistics cited in Transportation and Logistics 2030 PWC Report |
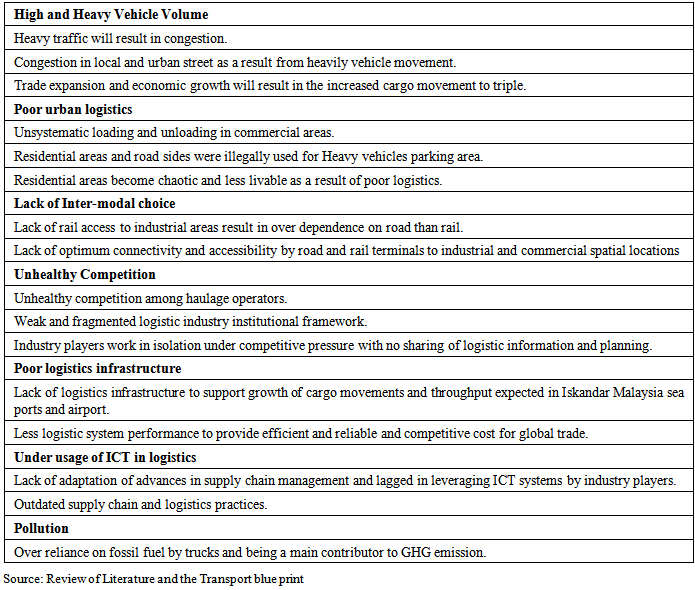
Table 3. Current issues in haulage industry in Malaysia
 |
| |
|
1.4. Barriers to Entry
a) The haulage business is difficult to start with due to high capital requirement. It is a high capital intensive business. [3], [23], [24], [25], [27],b) Economics of Scale. It is not profitable to operate a fleet of five to 10 trucks and it needs the economy of scale to sustain the business. [3], [23], [24], [27], c) Low profit margins. Haulers operators with large fleet and good management system, will easily enjoy a 5% to 10% margin. [3]d) Depots are far away from the port. Although some of the ports in Malaysia, have on-dock-depot at the port, it was still not efficient as there was only one gate for the trucks to collect and send the containers. [3], [23], [24],e) Besides the location, some container depot operators should improve their efficiency in material handling [3], [13], [23], [24].
2. Conclusions
This article explore issues and barriers to the growth of haulage industry in Malaysia. The objectives of this article are to identify issues and barrier to sustainable growth of the haulage industry. The review of the literature in haulage industry reveals that there are not many studies conducted to examine the issues and barriers to sustainable growth of haulage industry in Malaysia. Desk research was conducted on the latest publications on issues and barriers to sustainable growth of Malaysian haulage industries. Issues identified are high and heavy vehicle volume, poor urban logistics, lack of inter-modal choice, unhealthy competition, poor logistics infrastructure, under usage of ICT in logistics and pollution. The barriers to enter the industry are high capital intensive, economics of scale, low profit margins for small and medium operator, most of the depots are far away from the port and inefficiency in material handling. The Malaysian government need to be more alert on these issues and barriers that exists in the industry. Efforts to eliminate the issues and barriers in industry is much applaud to boost and create a sustainable growth in the industry.
References
| [1] | World Bank Report 2014. |
| [2] | Wikipaedia on line. |
| [3] | Association of Malaysian Haulers website. |
| [4] | Statistics Department of Malaysia report 2013. |
| [5] | Bank Negara Economic Report 2013. |
| [6] | Ministry of International Trade and Industry March 2014. |
| [7] | The Economist, 20 March, 1993,106. |
| [8] | The Edge Sunday, August 21, 2011. |
| [9] | The freight forwarding Malaysia Report 2012. |
| [10] | The Logistics Report 2013 Price Waterhouse Coopers. |
| [11] | The Star Online 2011,2012,2013. |
| [12] | Transportation and Logistics 2030 PWC Report. |
| [13] | Transport Bulletin KPMG LLP (UK) MAY - JUNE 2013. |
| [14] | ASEAN Economic Community Blueprint. |
| [15] | International Monetary Fund Report 1997. |
| [16] | Institute of Shipping Economics and Logistics 59. |
| [17] | Investopaedia Dictionary online. |
| [18] | International ECMT /OECD Symposium Economics Policy 25th-27 October 2006 Berlin. |
| [19] | Malaysia External Trade of Statistics March 2012.MITI. |
| [20] | MIDF Research.com 2013. |
| [21] | Organization for economic co-operation and development (2008) 17th symposium – benefiting from globalization – ISBN 978-92-821-0168-1. |
| [22] | The Department of Statistics Malaysia report 2013. |
| [23] | The Economist, 20 March, 1993,106. |
| [24] | The Edge Sunday, August 21, 2011. |
| [25] | The freight forwarding Malaysia Report 2012. |
| [26] | The Logistics Report 2013 Price Waterhouse Coopers. |
| [27] | The Star Online 2011, 2012, 2013. |
| [28] | Transportation and Logistics 2030 PWC Report. |
| [29] | Transport Bulletin KPMG LLP (UK) MAY - JUNE 2013. |
| [30] | Institute of Shipping Economics and Logistics. |
 Abstract
 Reference
 Full-Text PDF
 Full-text HTML