American Journal of Economics

p-ISSN: 2166-4951    e-ISSN: 2166-496X

2015;  5(2): 64-73

doi:10.5923/c.economics.201501.04

The Effects of Demographic Factors on Market Orientation

Jeen Wei Ong1, Peik Foong Yeap2, Hishamuddin Ismail1

1Faculty of Business, Multimedia University

2Faculty of Management, Multimedia University

Correspondence to: Jeen Wei Ong, Faculty of Business, Multimedia University.

Email:

Copyright © 2015 Scientific & Academic Publishing. All Rights Reserved.

Abstract

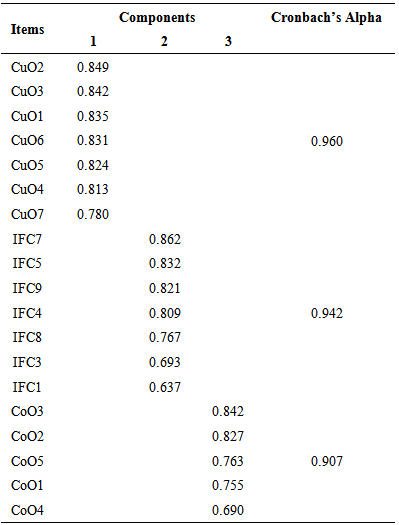
This study aims to examine the effects of demographic factors on market orientation culture among the small and medium enterprises (SMEs) in Malaysia. SMEs contribute greatly to an economy but SMEs in Malaysia were found to be lacked of competency. Market orientation culture was found to be an important strategic capability that enables firms to achieve sustainable competitive advantage. Thus, it is important to study the practices of market orientation culture among SMEs. This study adapted the MKTOR scale of market orientation. The original items of market orientation was validated through a content validity and pilot study. The data collection for the actual study was done through email. 517 usable responds were collected. The factor analysis confirmed that items of market orientation were segregated according to customer orientation, competitor orientation and interfunctional coordination. The findings of data analysis also concluded the impact of core industry, number of employees, main customer group, information and communication (ICT)-related operation and family ownership on market orientation culture.

Keywords: Market orientation, MKTOR scale, Demographic factors, Small and medium enterprises

Cite this paper: Jeen Wei Ong, Peik Foong Yeap, Hishamuddin Ismail, The Effects of Demographic Factors on Market Orientation, American Journal of Economics, Vol. 5 No. 2, 2015, pp. 64-73. doi: 10.5923/c.economics.201501.04.

1. Introduction

Small and medium enterprises (SMEs) make up important parts of economies. They occupy majority of the business establishments and contribute critically to the economic and social wellbeing. In Malaysia, SMEs were targeted to be the “game changer” in the transformation of the nation economy ([1]). Thus, there is a need to develop a larger pool of competitive SMEs in the nation ([1]). The competitiveness of the firms, according to resource-based theory ([2]) can be derived from the firms’ capabilities that are valuable, rare, imperfectly imitable and imperfectly substitutable. Nonetheless, the SMEs in Malaysia were generally found to be lacked of competitiveness. A possible reason is due to the lack of resources, especially the financial resources of SMEs to invest in strengthening the competency of the firms. Thus, heavy investment in build strategic capabilities among them would be unlikely. Therefore, market orientation culture would be an ideal strategic capability for SMEs to pursue ([3]).
Market orientation has long been studied as an important capability of a firm. In general, market orientation refers to the idea of generation, dissemination and use of market intelligent to create greater value for the customers ([4]). It directs the emphasis of a firm to the perspective of the customers with the main aim of satisfying them ([4], [5]). This capability is crucial to small and medium enterprises (SMEs) as the limited resources owned by them might restrict their access to other capabilities ([3]), especially the capabilities that required significant financial investment. Furthermore, market orientation was also found to be crucial in strengthening the firms’ innovation ([6-11]) and performance ([3], [6], [8], [12-21]). Thus, it is not surprise that the popularity of market orientation study had increased overtime and covered variety of areas and industries ([22]). Despites the research interest in market orientation, limited study has been directed to understand the effects of demographic factors on market orientation culture. Studying the impact of demographic factors would facilitate greater understanding on the market orientation practices in different firms’ settings. The findings could provide an important piece of knowledge to understand what characteristics of SMEs would foster greater implementation of market orientation culture in the firms.
The demographic factors include the SMEs’ years of establishment, core industry, size, main customer group, operating in information and communication technology (ICT)-related business, family and corporate ownership. The market orientation scale is adapted from MKTOR scale by [12]. The items were validated through a content validity and a pilot study before the actual data collection. The data is collected through survey on SMEs in Malaysia. Since modification was made on the [12]’s MKTOR scale, factor analysis is conducted to validate the construct validity of the scale and Cronbach’s alpha is used to ascertain the inter-item consistency of the concept. To test the effects of demographic factors on market orientation culture, the One-Way ANOVA and independent sample t-test are used. The next section further discussed the market orientation.

2. Literature Review

Market orientation culture has been tipped to be an important capability for the firms. This study argues that market orientation fulfilled the four criteria of valuable, rare, imperfectly substitutable and imperfectly imitable to contribute to firms’ sustainable competitive advantage as suggested by [2]. Firstly, market orientation is valuable as it is crucial in providing market intelligence to the firms. This market intelligence is important for the firms to outperform the competitors in providing greater value to the customers ([4], [12]). Furthermore, market orientation was found to be a good predictor for firm performance ([22]). Next, market orientation culture is rare. The findings of [23] in United Kingdom revealed that small businesses tend not to focus on marketing. Although [24] found the opposite in United States, [25]’s study in Malaysia shown that the score for market orientation among their sample was not particularly high. Furthermore, [25]’s sample did include approximately 35 percent of larger firms that were considered to be more market-oriented ([23]). Thus, this provide the evidence that not many SMEs in Malaysia were equipped with market orientation culture. Thirdly, the notion of market orientation as an imperfectly imitable capability can be proven as it is a culture that is deeply embedded within a firm ([4], [7]). Market orientation culture would require the firmwide commitment from the firms. Adding this firmwide commitment and the nature of ad hoc and short term decision making in SMEs, they form a socially complex system that is difficult to be imitated. Lastly, market orientation is imperfectly substitutable. Although market orientation could be substituted by other capabilities, [2] had argued that existence of substitutes does not automatically suggest that a capability is substitutable. Reference [3] argued that SMEs can hardly afford to build capabilities that required heavy financial investment thus viewed market orientation as an ideal capability for them. Furthermore, the findings of [7] revealed that a possible close substitute of market orientation – the entrepreneurial orientation was not able to explain firm performance as well as market orientation. Thus, these arguments conclude that market orientation is a strategic capability that can contribute to firm competitive advantage. Thus, it is not surprise that market orientation has received significant attention in previous studies.
The popularity of research on market orientation was on an increasing trend ([22]). The development of market orientation was mainly concentrating on the works of [12]’s MKTOR scale of market orientation and [26]’s MARKOR scale of market orientation. The MKTOR scale of market orientation was developed based on the literature of market orientation and sustainable competitive advantage ([12]). This scale focuses on the business cultural perspective of market orientation ([4]) with the emphasis on the customers ([27]). The MKTOR scale of market orientation consists of three factors, namely customer orientation, competitor orientation and interfunctional coordination ([12]). Together, they denote the ideas of understanding the customers, competitors and coordinate the firms’ resources and capabilities to create more values to the customers ([12]). The MARKOR scale of market orientation on the other hand emphasises mainly on the organisation aspect ([27]) by focusing on behavioural perspective in their measures ([4]). The three factors of MARKOR scale of market orientation are intelligence generation, dissemination and responsiveness ([26], [28]). This covers the activities of collecting market intelligence on customers, disseminate the information across functions within the firm and firm’s responses to the market intelligence ([28]). The MARKOR scale was developed mainly to overcome the limitations of the MKTOR scale in comprehensively addressing the factors satisfying customers’ needs and expectations, the speed of collecting and disseminating market intelligence and measuring the behaviour and activities aspects of market orientation ([28]).
Both MKTOR and MARKOR scales of market orientation were developed since more than two decades ago but continued to attract research attention. The MKTOR scale of market orientation was used in the studies like [8], [9], [11], [21] and [29] while MARKOR scale was adapted in the studies of [10], [18] and [20]. This evidenced that both market orientation scales remain relevant despites the passage of time. Various comparisons were made on these two market orientation scales as well. Reference [28] argued that the MARKOR scale was developed mainly to overcome the limitations of the MKTOR scale in comprehensively addressing the factors satisfying customers’ needs and expectations, the speed of collecting and disseminating market intelligence and measuring the behaviour and activities aspects of market orientation. In addition to that, [27] was in favour of MARKOR scale, citing the reasons that MARKOR scale was more consistent with the definition of market orientation and include the firms’ practices and capabilities in the measures. MKTOR scale on the other hand was criticised for neglecting the cultural dimension of market orientation, overly emphasising on the customer dimension and functioning only like a check list of market orientation activities ([27]). On the other hand, [3], [13] and [14] were in favour of MKTOR scale. They argued that MKTOR scale was more relevant to the context of small businesses ([3], [30]) and [13] concluded the superiority of MKTOR scale in term of convergent and discriminant validity. Reference [31] found both MKTOR and MARKOR scales to be highly consistence and correlated while [32] found that both of the scales could only achieve the desired level of model fit after several deletions of item were done.
This study adapts the MKTOR scale of market orientation in considering that this study is targeting on SMEs. As argued by [3] and [30], MKTOR scale was more relevant to the context of small businesses. In addition to that, additional consideration was given to the findings in [13] study that MKTOR scale was superior in term of convergence and discriminant validity. Nonetheless, the MKTOR scale would be further validated in this study through a content validity and a pilot study. The details are explained in the next section.

3. Research Methods

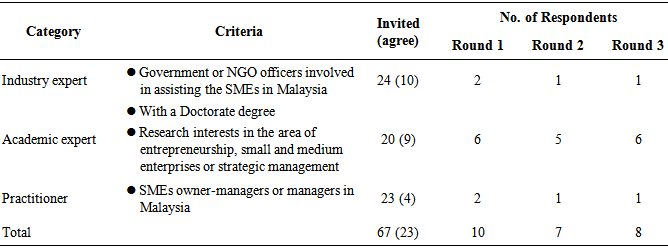
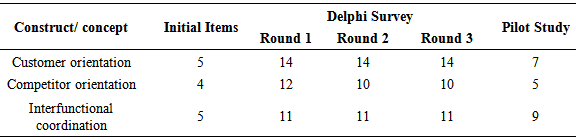
This section discusses the research framework, research instruments, the pilot study, sampling method, data collection method and statistical analysis methods. This study examines the impact of demographic factors including the SMEs’ years of establishment, core industry, number of employees, main customer group, ICT-related operation, family ownership and corporate ownership on market orientation culture. The main aim is to identify the characteristics of the SMEs that built better market orientation culture.
The research instrument for market orientation used in this study was adapted from [12]’s MKTOR scale of market orientation. The items were then went through the process of content validity and a pilot test before proceeding to the actual study. The content validity is to ensure that the instruments remain relevant and comprehensive to the latest business environment. This study adapted the Delphi method by [33] and [34] to conduct the content validity. The multi-round Delphi method can ensure that proper process of eliciting and evaluating of the items from the experts. The evaluation of content validity includes the dimensions of comprehensiveness ([35], [36]), relevancy and representativeness of the items in measuring the concepts ([37], [38]). The modified-Delphi method used in this study consisted of one pre-Delphi round, three rounds of actual Delphi survey and one round of post-Delphi methodological expert review ([39], [40]).
The pre-Delphi round involved identifying the initial items from [12] and invitation of experts to the study. The experts consist of academics, practitioners and industry experts. The number of experts invited, agreed to participate, and actual participations in each rounds were presented in Table 1 ([40]). In the first round of the Delphi survey, the experts were asked to add more items to each of the concepts according to the definition provided. This is to ensure the comprehensiveness of the items in measuring the concepts. The items were then compiled and condensed for the second round evaluation. In the second round, the experts were asked to evaluate the relevance of the items generated through the first round according to the definition for each concept on a dichotomous scale. The items rated as relevant by at least 80 percent of the experts ([41]) would be retained for further evaluation. The third round of Delphi survey rates the items remained after the second round evaluation for their importance in measuring the concepts. The experts were asked to evaluate the importance of the items on a four-point scale, ranging from not important to very important. The items with more than 80 percent of the experts rating on point three or four that indicated important and very important or the mean of the rating above three out of the four-point scale were retained. The number of items after each of the round is presented in Table 2. After the three rounds of Delphi survey, a methodological expert review was conducted to evaluate the appropriateness and clarity of the language used ([42]). The reviewers in this post-Delphi round of review consisted of three undergraduate students, six academics, two working adult, a businessman and a non-working adult. The main purpose is to ensure the wording used in the questionnaire is understandable.
Table 1. Criteria for expert selection and number of respondents
     
After the content validity, a pilot study was conducted. The objectives of the pilot study were to reduce the number of items, ensuring the unidimensionality and inter-item consistency of the items measuring the same concept. The survey for pilot study was conducted using a convenient sampling method. Between the period of September 2010 and December 2010, 75 set of questionnaires were collected but only 68 sets were usable. Factor analysis was conducted to reduce the number of items for each of the factors and to ensure the unidimensionality of the concepts ([43]). The items to be retained through the factor analysis must achieve communalities of at least 0.40 ([44]) and factor loading of 0.32 ([44]) In addition to that, Cronbach’s Alpha analysis was used to determine the inter-item consistency for each of the factors. The acceptable Cronbach’s Alpha was set as 0.70.
The final items retained for each of the market orientation factors is presented in Table 2. The initial items adapted from [12] were five items for customer orientation, four for competitor orientation and five for interfunctional coordination. During the first round of brainstorming, the number of items for all the three factors increased to 14, 10 and 11 respectively. The number of items for customer orientation and interfunctional coordination were retained to be 14 and 11 respectively after completing all the three rounds of Delphi survey while the items of competitor orientation were reduce to 10 from 12 in the second round and no further reduction of item in the third round. The number of items for each of the factors were further reduced in the pilot study. The factors analysis conducted based on the data collected through pilot study managed to reduce the number of items in customer orientation to 7, competitor orientation to 5 and interfunctional coordination to 9. All the factors fulfilled the inter-item consistency with Cronbach’s alpha higher than 0.70.
Table 2. Number of Items for each Factors after each Round of Delphi Method and Pilot Study
     
The final survey form consists of a cover page, a consent agreement and the items for demographic factors and market orientation. The consent agreement form is adapted from the Professor Dr. Paul Benjamin Lowry with his written consent. The consent agreement consists of research purpose, research sponsor, reminder on voluntary participation, contact person should the respondents have queries, promise on confidentiality of the respondents’ identity, benefits and risks of participating in the research, and the procedure to agree to participate in the study. The demographic questions include years of establishment, core industry, number of employees, main customer group, information and communication technology (ICT)-related business operations, family ownership and corporate ownership. Categorical scale was used to measure the demographic questions. The questions for market orientation were measured using a six-point scale, ranging from strongly disagree to strongly agree. The removal of neutral point is to avoid the problem of social desirability bias ([45]) that is particularly a concern for a study in Asia ([46]).
The sampling frame for this study made up of SMEs with email contact from the directories of Federation of Malaysian Manufacturer (FMM), Malaysia Development Corporation (MDeC), Small and Medium Enterprise Corporation Malaysia (SME Corp. Malaysia), and Malaysia SME Business Directory. The sampling frame consisted of 24,378 SMEs operating in various industry. The SMEs were contacted through email between February 2011 and November 2011. Only 12,863 emails reached the targeted respondents. After two reminders, 532 responses were collected in which 517 were usable. Email was used because it facilitates greater two-way communication between the researcher and the targeted respondents and enable the survey form to reach respondents throughout the nation with minimum cost and impact on the environment.
The data collected was analysed using SPSS. First, factor analysis was used to analyse the discriminant validity among the different factors. For the factor loading, the study uses the rules of 0.6/0.4 where the items with primary loading of higher than 0.60 and secondary loading of lower than 0.40 were retained ([47]). Then, Cronbach’s Alpha analysis was used to ascertain the inter-item consistency of each of the factors. The frequency analysis for the demographic factors and mean analysis for the market orientation would also be presented. Lastly, One-Way ANOVA and independent sample t-test were used to test the impact of demographic factors on the market orientation culture. The next section discusses the results and findings of the statistical analysis.

4. Statistical Results and Findings

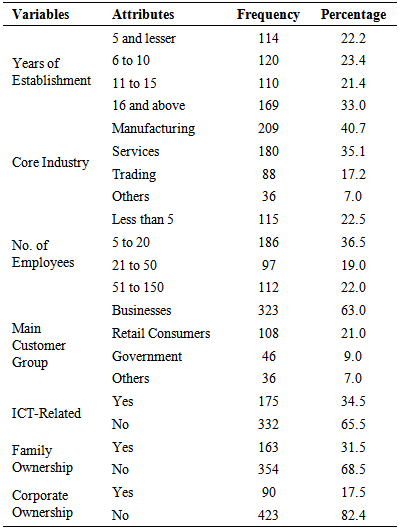
Table 3 shows the demographic profile of the SMEs that responded to the study. The SMEs were in different life cycle based on their years of establishment. They were well segregated into the four categories of years of establishment with 33.0 percent have established for 16 years and above, 23.4 percent form between 6 and 10 years, 22.2 percent for 5 years and below and another 21.4 percent for between 11 and 15 years. Majority of them were operating in manufacturing industry (40.7%) followed by services industry (35.1%). In term of the SMEs’ size as measured by the number of employees, the SMEs were found to be small in general with 59 percent of them were having 20 or lesser employees (22.5% with less than 5 employees while 36.5% with between 5 and 20 employees). Nonetheless, 22 percent of them were in the category of medium enterprises with between 51 and 150 employees. Most of the SMEs were supplying to another businesses as their major customers (63.0%) while another 21.1 percent of them were selling to the retail customers. In term of the nature of business, 34.5 percent of the SMEs were operating an information and communication technology (ICT)-related business, 31.5 percent were family-owned and 17.5 percent were direct subsidiary of another business.
Table 3. Demographic Profile of the Responding SMEs
     
Table 4 shows the results of factor analysis using principle components method and varimax rotation. The items were rotated into three components. Two items (IFC2 and IFC6) were deleted due to factor loading lower than 0.60 and communality lower than 0.50. The items were segregated accordingly to their respective factors as were developed through the content validity and pilot study. All the items had the factor loading above 0.60. Thus, consistent the previous studies, the market orientation were segregated into customer orientation (factor 1), interfunctional coordination (factor 2) and competitor orientation (factor 3). In addition to that, Cronbach’s Alpha was used to test the inter-item consistency among the items within a factor. The results show that all the three factors had high level of inter-item consistency.
Table 4. Factor Analysis for Market Orientation Construct
     
The results of mean analysis are presented in Table 5. The results showed that the mean for all the three factors in market orientation were well above the mid-point of the six-point scale used in this study. The mean for customer orientation was the highest with the value of 5.072 (standard deviation = 0.765), followed by interfunctional coordination (mean = 4.615; standard deviation = 0.834) and competitor orientation (4.553; standard deviation = 0.897). This showed that the SMEs were focusing heavily on understanding and satisfying the customers. Similarly, there is also evidence to show that the SMEs were emphasising on understanding the competitors and coordinate the information across different functions within the firms. Nonetheless, relatively lesser focus was given on these two dimensions of market orientation relatively to the customers.
Table 5. Descriptive Analysis for Market Orientation Constructs
     
Table 6 shows the results of One-Way ANOVA and independent sample t-test for the differences among the demographic variables of the SMEs on the customer orientation, competitor orientation and interfunctional coordination. In general, the results show that significant differences were found among the SMEs operating in different industries, serving different group of customers, operating ICT-related businesses and the family ownership. On the other hand, years of establishment, number of employees and corporate ownership did not have any impact on market orientation. The following paragraphs will discuss the findings in detail.
Table 6. One-Way ANOVA and T-Test for the Differences among SMEs in Market Orientation
     
The age of the SMEs, measured by years of the firms’ establishment, was not found to have any significant impact on customer orientation, competitor orientation and interfunctional coordination. SMEs with 6 to 10 years of establishment were found to score highest mean in customer orientation (mean = 5.196; standard deviation = 0.795) and interfunctional coordination (mean = 4.712; standard deviation = 0.819) and second highest in competitor orientation (mean = 4.585; standard deviation = 0.905) behind SMEs that were established for 16 years and above (mean = 4.586; standard deviation = 0.801). Nonetheless, no significant different was found in the One-Way ANOVA across all the three dimensions of customer orientation (F=1.660; p>0.05), competitor orientation (F=0.414; p>0.05) and interfunctional coordination (F=1.358; p>0.05).
The core industry of the SMEs was found to have a significant impact on customer orientation (F=3.861; p<0.05) but not on competitor orientation (F=0.974; p>0.05) and interfunctional coordination (F=2.250; p>0.05). SMEs in services industry were found to score the highest in customer orientation (mean=5.203; standard deviation = 0.695) and interfunctional coordination (mean=4.694; standard deviation=0.834) while SMEs in trading industry scored the highest in mean for competitor orientation (mean=4.673; standard deviation=0.884). It is also interesting to note that the score of competitor orientation for SMEs in services industry was the lowest with the mean of 4.512 (standard deviation=0.945). The results of One-Way ANOVA showed that SMEs in services industry performed significantly better than their counterparts in manufacturing industry in customer orientation (mean difference=0.191; p<0.05). The finding is expected as firms in service industry have closer interaction with the customers compared to the firms in manufacturing industry. No difference was found for the competitor orientation and interfunctional coordination among SMEs in services industry, manufacturing industry and trading industry.
For the impact of firm size on the market orientation, SMEs with more than 50 employees were found to have higher mean score for all three factors of market orientation; the customer orientation (mean=5.135; standard deviation=0.682), competitor orientation (mean=4.741; standard deviation=0.750) and interfunctional coordination (mean=4.818; standard deviation=0.756). The One-Way ANOVA results showed a significant difference among the firms with different size in interfunctional coordination (F=3.798; p<0.05) while no difference was found for customer orientation (F=0.293; p>0.05) and competitor orientation (F=2.111; p>0.05). For the significant difference in interfunctional coordination, the results of pos hoc analysis showed that SMEs with more than 50 employees scored significantly higher than SMEs with lesser than 5 employees (mean difference=0.368; p<0.05). The findings concluded that larger size firms with more organise organisational structure could be the reason for them to coordinate better throughout different functional departments within the firms.
The results of One-Way ANOVA also found significant difference in customer orientation (F=3.436; p<0.05) and interfunctional coordination (F=4.851; p<0.05) for SMEs focusing on serving difference customer groups. No significant difference was found in competitor orientation (F2.597; p>0.05). The SMEs focusing on government as their main customers were found have higher mean score in all three market orientation factors. Their mean in customer orientation was 5.326 (standard deviation=0.749), in competitor orientation was 4.765 (standard deviation=0.904) and in interfunctional coordination was 4.907 (standard deviation=0.645). Significant difference was found between SMEs focusing on government as their main customers and SMEs focusing on retail consumers as their main customers in customer orientation (mean difference = 0.342; p<0.05) and interfunctional coordination (mean difference = 0.444; p<0.05). This could be likely due to the lesser number of customers that they are dealing with and the bargaining power of the customers. Both of the factors require the SMEs to be fully concentrate to serve their customers when they are dealing with the government. The firm-wide commitment is needed in this case. This argument is further supported by the results of the study that SMEs focusing on businesses as their main customer group scored above their counterparts focusing on retail consumers in customer orientation and interfunctional coordination, although the results were not statistically significant. Thus, customers with stronger bargaining power could force the SMEs to be more market-oriented.
On top of that, involvement in ICT-related business and the family ownership were found to have impact on the market orientation of the SMEs. SMEs that operate in ICT-related businesses were found to be more customer oriented (t=3.021; p<0.05), competitor oriented (t=2.763; p<0.05) and foster greater coordination across different functions within the firms (t=3.198; p<0.05). This could be likely due to their familiarity with ICT. Nonetheless, further study is needed to ascertain the role of ICT in market orientation. On the other hand, family-owned SMEs were found to be significantly less focus on customer orientation compared to non-family-owned SMEs (t=-2.498; p<0.05). No difference was found between family-owned and non-family-owned SMEs in competitor orientation (t=-1.476; p>0.05) and interfunctional coordination (t=-1.906; p>0.05). The mean value for family-owned SMEs was lower than the non-family-owned SMEs in these two dimensions. Corporate ownership of the SMEs, on the other hand has no significant impact on market orientation. Although the mean for SMEs owned by a corporation was higher than the non-corporate owned SMEs in all three dimensions of market orientation, no significant difference was concluded. This shows that SMEs that are the direct subsidiary of a corporation do not enjoy significant advantage in term of being more market-oriented compared to their counterparts. However, evidence from the study showed that those that are owned by family were relatively weaker in customer orientation.

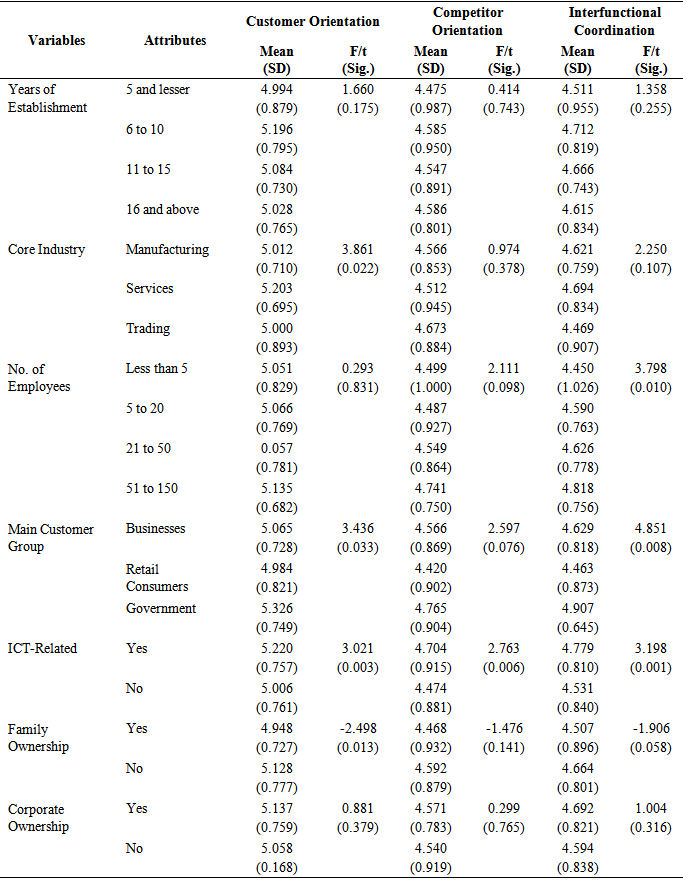
5. Discussion and Recommendations for Future Research

The findings of the study revealed that SMEs operating in ICT-related business and the main customer group they are serving were found to have impact on market orientation culture of the firms. In addition to that, their core industry, number of employees and family ownership were also found to have some effects on market orientation. No effect from years of establishment and corporate ownership were observed in this study.
The impact of the operation in ICT-related business has on market orientation culture could signal the importance of ICT in collecting market intelligence related to customers and competitors and facilitate greater cross-functional coordination in disseminating the market intelligence. The nature of SMEs involving in ICT-related business to be more ICT savvy could justify the argument. Nonetheless, further study to directly linking to ICT competence to the market orientation could provide clearer evidence to support the importance of ICT on market orientation. Next, the significance impact of main customer group on customer orientation and interfunctional coordination suggested the possibility that buyer bargaining power and concentration did play an important role in deciding firms’ level market orientation. The findings of this study concluded that SMEs focusing on serving government sector buyers were more customer-oriented and coordinated the market intelligence better across different functions relative to the SMEs focusing on retail consumers. Logically, the greater bargaining power from the public sector buyers could be an important factor explaining the findings. It is so clear that the public sector buyers are more concentrated and have stronger bargaining power over the retail consumers. Thus, the importance of external factors in influencing the firms’ level of market orientation could not be discounted as well. Further study might need to examine the drivers of market orientation from this perspective.
On the other hand, the SMEs’ core industry, number of employees and family ownership were also found to have some extend of impact on market orientation culture. SMEs in services industry were found to be more superior to their counterparts in trading businesses in term of customer orientation. This is well expected as the nature of services businesses naturally needs greater interaction with their customers in the process of providing the services. Moreover, the element of personalisation in services also required the service providers to greatly understand the special requirements of the customers. This has made them more customer-oriented. In term of number of employees, it was only found that the larger SMEs benefits from greater coordination across different functions within the firms but they were not found to utilise their larger size to gain more market intelligence on their competitors and customers. Similarly, the claim that the smaller size firms have the advantage of greater understanding of customers by staying closers to them was not supported by the statistical results of this study. Family-owned SMEs were interesting found to be less customer-oriented compared to non-family-owned SMEs. The family-owned SMEs were also found to score lower for the competitor orientation and interfunctional coordination. This could raise the question on whether the family-owned SMEs are less capable in managing the firms as a whole. The unique features of family-owned SMEs could set barriers for recruiting and retaining the talents. Furthermore, the possibility of the family members dominating the management would heavily influence the decision-making of the firms, including a decision to prioritise the interest of family members over committing greater resources to serve the customers. Nonetheless, this would require more evidence from future research to conclude.
The insignificant of years of establishment and corporate ownership on market orientation culture indicated that the SMEs failed to capitalise their experience and the advantage of having a parent firm to build a more market-oriented culture. The greater experience in the business should theoretically enable the SMEs to have greater understanding on their customers and competitors. Nonetheless, the agility of the younger SMEs to enter the market with greater understanding of the customers and competitors and more readily to act on the market intelligence could offset the greater experience of the larger counterparts. This could be explained through the high mean score for SMEs across different categories of years of establishment. Similarly, the advantage of the support from the parent firms for corporate-owned SMEs could be offset of the flexibility and faster decision making in the independent SMEs.
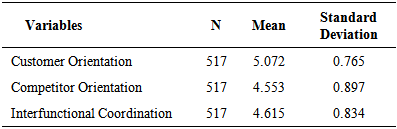
6. Conclusions

This study validate the MKTOR scale of market orientation for content validity and inter-item consistency. The MKTOR scale of market orientation were divided into three factors, namely customer orientation, competitor orientation and intefunctional coordination. In the context of SMEs, the study found that SMEs were focusing on all three dimensions of market orientation, especially in term of customer orientation. In addition to that, this study concludes the effects of core industry, number of employees, main customer group, ICT-related operations and family-based ownership on market orientation. Based on the findings of the study, future research should be directed to examine further on the impact of ICT, buyers bargaining power and concentration have on the market orientation.

References

[1]  SME Corporation Malaysia, SME Master Plan 2012 – 2020, SME Corporation Malaysia, Malaysia, 2012.
[2]  J. B. Barney, “Firm Resources and Sustained Competitive Advantage”, SAGE Journal, Journal of Management, vol. 17, no. 1, pp. 99 – 120. 1991.
[3]  A. M. Pelham and D. T. Wilson, “A Longitudinal Study of the Impact of Market Structure, Firm Structure, Strategy, and Market Orientation Culture on Dimensions of Small-Firm Performance”, Springer, Journal of the Academy of Marketing Science, vol. 24, no. 1, pp. 27 – 43, 1996.
[4]  E. M. Van Raaij and J. W. Stoelhorst, “The Implementation of a Market Orientation – A Review and Integration of the Contributions to Date”, Emerald Group Publishing Limited, European Journal of Marketing, vol. 42, no. 11/12, pp. 1265 – 1293, 2008.
[5]  P. Drucker, The Practice of Management, Harper and Row, USA, 1954.
[6]  F. H. H. M. Verbees and M. T. G. Meulenberg, “Market Orientation, Innovativeness and Performance in Small Firm”, John Wiley & Son, Inc., Journal of Small Business Management, vol. 42, no. 2, pp. 134 – 154., 2004.
[7]  W. E. Baker and J. M. Sinkula, “Does Market Orientation Facilitate Balanced Innovation Programs? An Organisational Learning Perspective”, John Wiley & Son, Inc., The Journal of Product Innovation Management, vol. 24, no. 4, pp. 316 – 334 , 2007.
[8]  J. Zhang and Y. Duan, “The Impact of Different Types of Market Orientation on Product Innovation Performance – Evidence from Chinese Manufacturers”, Emerald Publishing Group, Management Decision, vol. 48, no. 6, pp. 849 – 867, 2010.
[9]  H. N. Nasution, F. T. Mavondo, M. J. Matanda. And N. O. Ndubisi, “Entrepreneurship: Its Relationship with Market Orientation and Learning Orientation and as Antecedents to Innovation and Customer Value”, Elsevier, Industrial Marketing Management, vol. 40, no. 3, pp. 336 – 345, 2011.
[10]  J. Rodriguez-Pinto, P. Carbonell and A. I. Rodriguez-Escudero, “Speed or Quality? How the Order of Market Entry Influences the Relationship between Market Orientation and New Product Performance”, Elsevier, International Journal of Research in Marketing, vol. 28, no. 2, pp. 145 – 154, 2011.
[11]  J. Hong, T. H. Song and S. Yoo, “Paths to Success: How Do Market Orientation and Entrepreneurship Orientation Produce New Product Success?” John Wiley & Son, Inc., Journal of Product Innovation Management, vol. 30, no. 2, pp. 44 – 55, 2013.
[12]  J. C. Narver and S. F. Slater, “The Effect of a Market Orientation on Business Profitability”, American Marketing Association, Journal of Marketing, vol. 54, no. 4, pp. 20 – 35, 1990.
[13]  A. M. Pelham, “Mediating Influences on the Relationship between Market Orientation and Profitability in Small Industrial Firms”, M. E. Sharpe, Inc., Journal of Marketing Theory and Practices, vol. 5, no. 3, pp. 55 – 76, 1997.
[14]  A. M. Pelham, “Influence of Environment, Strategy, and Market Orientation on Performance in Small Manufacturing Firms”, Elsevier, Journal of Business Research, vol. 45, no. 1, pp. 33 – 46, 1999.
[15]  C. Homburg and C. Pflesser, “A Multiple-Layer Model of Market-Oriented Organisational Culture: Measurement Issues and Performance Outcomes”, American Marketing Association, Journal of Marketing Research, vol. 37, no. 4, pp. 449 – 462, 2000.
[16]  G. T. M. Hult, D. J. Ketchen Jr. and S. F. Slater, “Market Orientation and Performance: An Integration of Disparate Approaches”, John Wiley & Son, Inc., Strategic Management Journal, vol. 26, no. 12, pp. 1173 – 1181, 2005.
[17]  G. G. Panigyrakis and P. K. Theodoridis, “Market Orientation and Performance: An Empirical Investigation in the Retail Industry in Greece”, Elsevier, Journal of Retailing and Consumer Services, vol. 14, no. 2, pp. 137-149, 2007.
[18]  P. S. Davis, E. Babakus P. D. Englis, and T. Pett, “The Influence of CEO Gender on Market Orientation and Performance in Service Small and Medium-Sized Service Businesses”, John Wiley & Son, Inc., Journal of Small Business Management, vol. 48, no. 4, pp. 475 – 496, 2010.
[19]  A. H. Kirca, “The Effects of Market Orientation on Subsidiary Performance: Empirical Evidence from MNCs in Turkey”, Elsevier, Journal of World Business, vol. 46, no. 4, pp. 447 – 454, 2011.
[20]  Kumar, V., Jones, E., Venkatesan, R. and Leone, R. P. (2011). Is Market Orientation a Source of Sustainable Competitive Advantage or Simply the Cost of Competing? American Marketing Association, Journal of Marketing, 75(1), 16 – 30.
[21]  Julian, C. C., Mohamad, O., Ahmed, Z. U. and Sefnedi, S. (2014). The Market Orientation-Performance Relationship: The Empirical Link in Export Ventures. John Wiley & Son, Inc., Thunderbird International Business Review, 56(1), 97 – 110, 2014.
[22]  S. Liao, W. Chang, C. Wu, and J. M. Katrichis, “A Survey of Market Orientation Research (1995 – 2008)”, Elsevier, Industrial Marketing Management, vol. 40, no. 2, pp. 301 – 310, 2011.
[23]  D. Stokes and R. Blackburn, “Entrepreneurship: Building for the Future”, Small Business Research Centre Kingston University, London, Working Paper Series, 1999.
[24]  C. Blankson and J. M. Cheng, “Have Small Businesses Adopted the Market Orientation Concept? The Case of Small Businesses in Michigan”, Emerald Group Publishing, Journal of Business & Industrial Marketing, vol. 20, no. 6, pp. 317 – 330, 2005.
[25]  T. Ramayah, N. Samat and M. Lo, “Market Orientation, Service Quality and Organisational Performance in Service Organisations in Malaysia”, Emerald Group Publishing, Asia Pacific Journal of Business Administration, vol. 3, no. 1, pp. 8 – 27, 2011.
[26]  A. K. Kohli, and B. J. Jaworski, “Market Orientation: The Construct, Research Propositions, and Managerial Implications”, American Marketing Association, Journal of Marketing, vol. 54, no. 2, pp. 1 – 18, 1990.
[27]  C. Gauzente, “Comparing Market Orientation Scales: A Content Analysis”, Massey University, Marketing Bulletin, vol. 10, no. 4, pp. 76 – 82, 1999.
[28]  A. K. Kohli, B. J. Jaworski, and A. Kumar, “MARKOR: A Measure of Market Orientation”, American Marketing Association, Journal of Marketing Research, vol. 30, no. 4, pp. 467 – 477, 1993.
[29]  A. B. Brik, B. Bettab, and K. Mellahi, “Market Orientation, Corporate Social Responsibility, and Business Performance”, Springer, Journal of Business Ethics, vol. 99, no. 3, pp. 307 – 324, 2011.
[30]  A. F. Pelham, “Mediating and Moderating Influences on the Relationship Between Market Orientation and Performance”, PhD Dissertation: Pennsylavania State University, 1993.
[31]  C. A. Conrad, “Market Orientation and the Innovative Culture: A Preliminary Empirical Examination”, John Wiley & Son, Inc., Journal of Strategic Management, vol. 7, no. 4, pp. 229 – 236, 1999.
[32]  M. A. Farrell and E. Oczkowski, “An Analysis of the MKTOR and MARKOR Measures of Market Orientation: An Australian Perspective”, Massey University, Marketing Bulletin, vol. 8, pp. 30 – 40, 1997.
[33]  R. C. Schmidt, K. Lyytinen, M. Keil and P. Cule, “Identifying Software Project Risks: An International Delphi Study”, M. E. Sharpe, Journal of Management Information System, vol. 17, no. 4, pp. 5 – 36, 2001.
[34]  C. Okoli and S. D. Pawloski, “The Delphi Method as a Research Tool: An Example, Design Considerations and Applications”, Elsevier, Information and Management, vol. 42, no. 1, pp. 15 – 29, 2004.
[35]  U. Sekaran and R. Bougie, Research Methods for Business – A Skill Building Approach, 5th Edition, John Wiley & Son, United Kingdom, 2011.
[36]  W. L. Neuman, Basics of Social Research: Qualitative and Quantitative Approaches, Pearson Education, Inc, USA, 2013.
[37]  S. N. Haynes, D. C. S. Richard, and E. S. Kubany, “Content Validity in Psychological Assessment: A Functional Approach to Concepts and Methods”, American Psychological Association, Psychological Assessment, vol. 7, no. 3, pp. 238 – 247, 2005.
[38]  D. R. Tojib, and L. Sugianto, “Content Validity of Instruments in IS Research”, AIS Electronic Library, Journal of Information Technology Theory and Application, vol. 8, no. 3, pp. 31 – 56, 2006.
[39]  J. W. Ong, I. Hishamuddin and P. F. Yeap, “Proposing a Modified-Delphi Method for Questionnaire Development and Validation in Entrepreneurship Study”, in Proceeding of Global Conference on SME & Entrepreneurship, pp. 1 – 8, 2010.
[40]  J. W. Ong, P. F. Yeap, and I. Hishamuddin Ismail, “Developing Management ICT Commitment through a Modified Delphi Methods”, in Proceedings of the Asia Academy of Management International Conference 2011, pp. 143 – 150, 2011.
[41]  D. M. Rubio, M. Berg-Weger, S. S. Tebb, E. S. Lee and S. Rauch, “Objectifying Content Validity: Conducting a Content Validity Study in Social Work Research”, Oxford University Press, Society of Social Work and Research, Social Work Research, vol. 27, no. 2, pp. 94 – 104, 2003.
[42]  K. L. Goldenberg, A. E. Anderson, D. K. Willimack, S. R. Freedman, R. H. Rutchik, and L. M. Moy, “Experiences Implementing Establishment Survey Questionnaire Development and Testing at Selected U.S. Government Agencies” Paper presented at the International Conference on Questionnaire Development, Evaluation, and Testing Methods, 2002.
[43]  J. F. Hair Jr., W. C. Black, B. J. Babin, and R. E. Anderson, Multivariate Data Analysis, 7th Edition, Prentice Hall, USA, 2010.
[44]  A. B. Costello and J. W. Osborne, “Best Practices in Exploratory Factor Analysis: Four Recommendations for Getting the Most from Your Analysis”, PAREonline, Practical Assessment, Research & Evaluation, vol. 10, no. 7, pp. 1 – 9, 2005.
[45]  R. Garland, “The Mid-Point on a Rating Scale: Is it Desirable”, Massey University, Marketing Bulletin, vol. 9, no. 1, pp. 66 – 70, 1991.
[46]  S. X. Si and J. B. Cullen, “Response Categories and Potential Cultural Bias: Effects of an Explicit Middle Point in Cross-Cultural Surveys”, Emerald Publishing Group, International Journal of Organizational Analysis, vol. 6, no. 3, pp. 218 – 230, 1998.
[47]  M. Matsunaga, “How to Factor-Analyse Your Data Right: Do’s, Don’ts, and How-To’s” Universidad de San Buenaventura, International Journal Psychological Research, vol. 3, no. 1, pp. 97 – 110, 2010.