-
Paper Information
- Next Paper
- Paper Submission
-
Journal Information
- About This Journal
- Editorial Board
- Current Issue
- Archive
- Author Guidelines
- Contact Us
American Journal of Economics
p-ISSN: 2166-4951 e-ISSN: 2166-496X
2013; 3(C): 57-66
doi:10.5923/c.economics.201301.11
The Effects of Macro-economic Indicators on Stock Returns: Evidence from Kuwait Stock Market
 Abstract
 Reference
 Full-Text PDF
 Full-text HTML
Hamdan Ahmed Ali Al-Shami, Yusnidah Ibrahim
Scholl of Economy, Finance and Banking, College of Business, University Utara Malaysia, Kedah, 06010, Malaysia
Correspondence to: Hamdan Ahmed Ali Al-Shami, Scholl of Economy, Finance and Banking, College of Business, University Utara Malaysia, Kedah, 06010, Malaysia.
| Email: |  |
Copyright © 2012 Scientific & Academic Publishing. All Rights Reserved.
The purpose of this study is to examine the impact of macroeconomic indicators (inflation, interest rate, money supply, oil prices, and unemployment rate) on Kuwait stock market. Basic indicators of Kuwait economy were analyzed using VAR model for the period from January 2001 to Dec 2010 on a monthly basis. A positive association was found between inflation, money supply and oil price in 1-month time and stock return while there is a negative relationship between interest rate in 1-month time and stock return in Kuwait stock market. There is a positive relationship between interest rate in 2-month time and stock return in Kuwait stock market and finally, there is a negative relationship between inflation, money supply and oil prices in 2-month time and stock return in Kuwait stock market.
Keywords: Kuwait Stock Market, Arbitrage Pricing Theory, VAR Model
Cite this paper: Hamdan Ahmed Ali Al-Shami, Yusnidah Ibrahim, The Effects of Macro-economic Indicators on Stock Returns: Evidence from Kuwait Stock Market, American Journal of Economics, Vol. 3 No. C, 2013, pp. 57-66. doi: 10.5923/c.economics.201301.11.
Article Outline
1. Introduction
- The attempts of each of the GCC countries to introduce economic diversification, privatization of public sectors, use technological development in trading technology and improve the INFastructure of both legal and financial institutions led to market development in the 1990s, resulting in the attraction and involvement of some foreign individuals and institutional investors (Hammoudeh & Aleisa, 2004). It is without a doubt that these six members of the GCC represent attractive emerging markets (Hammoudeh & Choi, 2006).In line with the economic development of GCC is the advancement in the stock market. It is interesting to note that stock markets in GCC are comparatively new. Stock trading began in 1952 in Kuwait, when the first shareholding company was established namely, the National Bank of Kuwait. Now, GCC stock market encompasses of 7 stock markets, 2 markets in United Arab of emirates. The GCC stock markets have generally shown a significant growth during the period from 2002 to 2007. Nevertheless, towards the end of 2008, most stock market indices in all GCC stock markets experienced a significant drop owing to the international financial crisis. As a result, total market capitalization decreased to US$560 billion; a mere 47% of its value in 2007 (Standard and Poor's Global Stock Markets Factbook, 2008 and Securities and Commodities Authority, United Arab Emirates, 2009).Among all the stock markets in GCC, Kuwait Stock Market has the longest history whereby it has gone through various institutional and regulatory changes.The Kuwait Stock Exchange (KSE) revealed considerable decline in 2008 along with the GCC and global markets. Moreover, almost the entire sectors had to handle large sell-offs with the index at an all-time low. By the end of 2008, KSE’s loss was reported at approximately 52.17% (approx. KWD 27 bn) of its market capitalization. Companies were faced with significant losses during this time and several companies were on the verge of bankruptcy. A more positive experience was felt in 2009 with the average volatility for the months from Oct-2009 to Nov-2010 registered at around 8%. This was associated to low trading volume during a time when investors have lost faith in the market. In the fourth quarter of 2009 and the first quarter of the following year, the trading volumes showed significant increase and then sharply drop in the second quarter of 2010. This is followed by another increase in the next quarter. In 2010, the index continued its decline to close at 6891 points on November 2010, compared to 6933 in November 2009. As mentioned, the index increased in the fourth quarter of 2009 and the first quarter of the following year only to decline in the second quarter of 2010. During this period, services formed the best performing sector closing at approximately 14920 points in November 2010. It is notable that the index failed to reach 8000 points during the stated period”.1Only negligible information exists on the factors that influence the stock returns in GCC stock markets in general and Kuwait stock market in particular. This is evidenced by AbdulRahman, Sidek and Tafri’s (2009) study which stated that various studies dedicated to the determinants of stock prices and stock returns have been undertaken on stock market in developed countries (e.g. USA, UK, Canada) as well as emerging countries (e.g. Chen, 2007). The latter study investigated the relationship between macro-economic and microeconomic explanatory variables and Chinese hotel stock returns. Chen (2007) suggests that more studies should be undertaken regarding the topic through the utilization of data from other countries and markets. Additionally, several studies (Gunsel and Cukur, 2007; Chen, 2007; Gay, 2008 and Tunali, 2010) have also examined the effects of macro-economic, oil prices and firm-specific variables on stock returns but not for the particular markets concentrated in this study.The current study thus is conducted to explore the influence of macro-economic factors and oil prices on stock returns in Kuwait Stock Market. Based on 120 numbers of observations and VAR method, it is found there is a positive association between inflation, money supply and oil price in 1-month time and stock return while there is a negative relationship between interest rate in 1-month time and stock return in Kuwait stock market. It is found that there is a positive relationship between interest rate in 2-month time and stock return in Kuwait stock market and finally, there is a negative relationship between inflation, money supply and oil prices in 2-month time and stock return in Kuwait stock market.The rest of the paper is organized as follows; Section 2 presents the brief history and development of KSE followed by literature reviews in Section 3. Research methodology is discussed in Section 4. Section 5 provides the empirical findings and discussion, finally, conclusion and recommendation for further research is presented in Section 6.
2. Overview of KSE
- Going back in history, the whole scene started in one of the city area basements in 1962. At that time, it had an informal beginning, until it received a legal recognition in 1970. In those years, the Kuwaiti government tried to help the private sector by giving free land and cheap loans to encourage companies to invest in Kuwait rather than abroad. In 1977, the market collapsed after the huge increase in oil revenues and the increase in private wealth which in turn, increased the activity in the stock market. By using forward contracts, two dealers would strike a forward deal at an agreed price including a premium over the spot price. After establishing the official stock exchange (Boursa) and banning the forward contracts, trading activity was regained by the end of 1978. Then Souk Al-Manakh was created as a parallel market to trade stocks in companies banned to enter the official stock exchange due to the failure to fulfill the meeting the listing requirements.The Kuwaiti-owned Gulf based companies’ shares were traded in Souk Al-Manakh using forward dealing for trading and post-dated checks for payment. This enabled one broker to sell a share on the spot market and buy it back on the forward market, obtaining cash which could then be lent out on the stock market at high rates. He could then repeat this several times in sequence using same shares and generate cash each time. Therefore, individuals wanted that quick profit and even non-Kuwaitis who were unable to access official stock exchange were able to purchase in Al-Manakh. Most Gulf companies only existed on paper and more were created just to provide shares for the market where such shares reached a rise of 200% in value, leaving the official market 50% lower compared to Gulf companies (Al-Yahya, 1993).At that time, the government considered Al-Manakh illegal and therefore, could not be held responsible for regulating it. It was not until mid-1982 when both market shares began to slow downwards leaving checks that were due unpaid and depressing the public. The crisis size was then attributed to the destruction of the commercial sector. The government eventually started to support the Boursa by purchasing shares worth KD 250 million. Moreover, the Clearing Company was established to bail out the post-dated checks (Al-Yahya, 1993). The government outlay on share purchase in 1977 was KD 150 million at a time when the Kuwait oil revenue was worth KD 20 million per day. But in 1983, Al-Manakh crisis absorbed over KD 2 billion, when on average, daily revenue was KD 5million only. At that time, Kuwait‘s GDP was about 21.6 billion US dollars and both stock markets - the Manakh and the official market combined, were worth 100 billion US dollars (AlShall, 2007). The injection of liquidity encouraged the regaining of confidence in the stock market known as the Kuwait Stock Exchange (KSE). The new building was built in 1985 and strong regulations regarding brokers were allowed and capitals were legislated. Regulations regarding the lag between trading and payments enabled change into cash within 3 working days. In 1988, liquidity continued to increase as a result of stability in the region until the Iraqi invasion of Kuwait on August 1990, when all operations were suspended (Al-Yahya, 1993).
3. Literature Review
- Many studies have been dedicated to the exploration of the fundamental factors driving stock returns through the guidance of asset pricing models including Arbitrage Pricing theory (APT) and Capital Asset Pricing Model (CAPM). Research in the field of finance has mainly stressed on the role of market-wide forces comprising the market portfolio and macro-economic variables, for the purpose of predicting or explaining returns. Contrary to the situation in finance, in accounting, firm-specific accounting variables are generally used to explain returns.CAPM was introduced by Sharp (1964), Lintner (1965) and Mossin (1966). It states that non-diversifiable market risk impacts expected security returns. The general notion behind the model is that compensation is provided for the investors due to the time value of money or systematic risk which is characterized by the risk-free rate (rf), whereby; the investors are compensated for investing over a certain period of time. Another compensation for taking up extra risk can be calculated through a risk measure (Beta) by comparing the asset returns with the market for a time period and with the market risk premium. The model takes into account the security’s risk free rate and market rate return in calculating the expected rate of return. From this model, a security is said to be well priced if its estimated price equates the future cash flow’s present value when discounted at the rate suggested by the CAPM and given its relative riskiness (Shefrin and Statman, 2000; and Frencha, 2003). On the other hand, if it is reported that price is greater than the CAPM valuation, the security is said to be undervalued and if it is lower than the CAPM valuation, then it is overvalued (Daniel, Hirshleifer, Subrahmanyam, 2001).The APT was established by Ross (1976) as a CAPM alternative. APT suggests different sources of risk in the economy that cannot be eradicated by sole diversification. These sources can be considered as related to economy wide factors like inflation and changes in the aggregate output. In addition, in APT, instead of the calculation of a single beta like CAPM, many betas are calculated through the estimation of the sensitivity associated with assets return to changes within each factor (Ross and Walsh, 1983).According to Altay (2003), the APT’s power and its generality are considered as its main strength as well as its weakness. This is because while APT enables the selection of the factors providing most suitable data explanation, it does not explain variation in asset return through limited number of easily determined factors. Based on French (2003), APT has its basis on the premise that portfolio stock returns are predictable through their linear relationship with several independent macro-economic variables. Its calculations are based on the ability of an arbitrageur to make theoretically risk free profits from a misplaced security whose price is not equal to expected price at the etnd of the period discounted at the rate indicated by the model (De Jong Rosenthal, Dijk. 2003 and Dong, Hirshleifer, Richardson and Teoh.2006).Underpinned by the above two asset pricing theories, there have been numerous researches that point to the fact that macro-economic factors impact stock returns. Nevertheless, studies regarding the effect of these factors upon developing stock markets are still limited. Fama (1981) revealed the existence of a significant macro-economic factors-stock prices association. Immediately following his study, many studies have attempted to explain the basic relationship in a single country or countries. Owing to the trend of globalization in the previous two decades, several authors including Canova and de Nicolo (1995) and Nasseh and Strauss (2004) carried out an investigation into the macro-economic indicators’ international impact on stock prices. However, majority of the research were carried out in the West (U.S.A. and European Countries). Coleman and Tettey (2008) investigated the macro-economic factors’ impact upon the stock exchange of Ghana and revealed that lending rates and inflation rates impact the stock market performance. The results of their study also revealed that indicators of macro-economic factors should be kept in mind when studying investors in developing countries. Previous studies regarding the association between stock price/return and some macro-economic factors are discussed next.a- Inflation RateQuayes and Jamal (2008) argued that when inflation increases, the rate of nominal interest rate rises owing to the increase in the bonds’ demand. This decreases the demand for stocks because stocks and bonds generally compete in the allocation of portfolio. As a result, increased inflation rate decreases the desire for business firms to issue bonds for the purpose of raising funds as this would require locking into payments of higher nominal interest rate.Junttila, Larkomaa and Perttunen (1997) revealed a negative association between unexpected inflation and the stock market in Finland. Similarly, Udegbunam and Eriki (2001), in their investigation of the effect of inflation on the Nigerian Stock Market, indicated that inflation has a significant measure of negative impact on the Stock Market.In the context of Malaysia and Indonesia, Abd.Majid, Meera, Azis and Ibrahim (2001), revealed that the stock returns are independent of inflationary trends in the Malaysian economy; a finding that is consistent with the Fisher hypothesis implying that the Malaysian Stock Market has a good protection against inflation. Unfortunately, a contrary result was found in Indonesia as a negative relation was revealed between real stock returns and inflationary trends. Furthermore, Azeez and Yonezawa (2006) revealed inflation to have a significant impact upon the expected returns in each of the sample period. In another similar study, Al-Mutairi and Al-Omar (2007) explored the impact of inflation upon the value of traded shares in Kuwait’s Stock Market and indicated a negative and long term effect of inflation on the value of traded shares, consistent with the asset pricing theories. Thaker, Rohilina ,Hassama and Bin Amin (2009) conducted an examination of the long-run equilibrium between inflation and stock prices in Malaysia and found contrary results where a positive relationship between inflation rate (CPI) and stock prices was evidenced.b- Interest Rate The association between share prices and interest rate is manipulated by investors in portfolios of bonds and stocks (Apergis and Eleftheriou, 2002). Investors generally prefer higher interest rate bonds as this suggests that stock prices will eventually decrease. Contrarily, a decrease in interest rate results in increase in stock prices. This indirect relationship was discovered by Gjerde and Saettem (1999), Praphan and Sharma (2002), Paul and Mallik (2003), Nasseh and Strauss (2004), McMillan (2005), Puah and Jayaraman (2007) and Reilly, Wright and Johnson (2007).In the context of Bogota, Arango, González and Posada (2002) found a non-linear trend and an inverse relation between the price of shares in the Bogota Stock Market and rate of interest measured through the inter bank loan interest rate, which is influenced to a degree by the monetary policy. The model developed for the study encapsulated the stylized fact of this market characterized by high dependence of returns in short terms. In a study involving Singapore and the U.S., Wong, Khan and Du (2005) revealed that prior to the 1997 Asian Financial Crisis, Singapore’s Stock Market were co-integrated with interest rate. After the crisis, this existing equilibrium disintegrated. A similar scenario was also observed in the U.S. markets whereby the prices of stocks integrated with macro-economic variables before the advent of the 1987 Equity Crisis with the equilibrium broken after the crisis and eventually disappeared after the 1997 Asian Crisis.This result is further compounded by the study conducted by Al-Mutairi and Al-Omar (2007) who revealed a negative and long term effect of interest rate on the value of traded shares which are reflected on the stock price.In a recent study, Alam and Salah Uddin (2009) examined in the context of developed and developing countries in the light of the relationship between interest rate and stock price. They stated that individual country results are mixed for both developed and developing countries. In the context of Malaysia, it is revealed that interest rate is not related to share price although interest rate changes had a negative relation with share price changes. In the contexts of Bangladesh, Columbia, Italy and South Africa, a negative relation was revealed between stock price and interest rates, and changes in both. While in the contexts of eight countries including Australia, Canada, Chile, Germany, Jamaica, Mexico, Spain, and Venezuela, a negative significant association is revealed between interest rates and stock price although no association was revealed between their changes. With the exception of the Philippines, in the rest of the countries, significant negative relationships stock price and interest rates, and between changes of interest rate with changes of stock price are revealed.c- Money Supply “The Keynesian economists2 discuss that variation in the money supply will move the stock prices only if the variation in the money supply alters expectations about future monetary policy. According to them, a positive money supply shock will lead publics to expect tightening monetary policy in the future. They bid for moneys in anticipation of tightening of money supply in the future, which will drive up the current rate of interest. As the interest rate goes up, the discount rates go up as well while the present value of future earnings drops. Stock prices, consequently drop. Furthermore, they discuss that economic events drop as a result of an increase in interest rates, which further reduces stock prices” (Sellin, 2001p:500 ).There are several studies which found a positive relationship between money supply and share price. Junttila, Larkomaa and Perttunen (1997) found that money supply is significantly positively and statistically associated with stock price in Finland Stock Market. This finding is consistent with Al-Sharkas’s study (2004) which revealed that money supply (M2) has a positive impact on the Amman Stock Market. Wong, Khan and Du (2005) carried out a study in Singapore and U.S for the period prior to the 1997 Asian financial crisis. The findings showed that Singapore’s stock markets were co-integrated with the money supply and this integration dissolved when the crisis came. In the context of U.S., there was co-integration between share prices and macro-economic variables before the equity crisis in 1987. Similarly, this equilibrium was disrupted in the 1987. In the Malaysian context, Rahman, Sidekand Tafri (2009) conducted a study on KLSE and their findings revealed that variables of monetary policies, e.g. proxied by money supply have a positive and significant impact on Malaysia’s stock market.In sum, majority of the studies discussed in this section revealed that money supply has a positive impact on stock market price. Nevertheless, there are a few studies revealing that money supply has no impact on stock market. For instance, the study conducted by Türsoy, Günsel and Rjoub (2008) concerning the testing of the impact of money supply in Istanbul Stock Exchange, revealed that money supply has no significant effect on stock returns. d- Oil prices According to Fang (2010), significant oil prices may affect the global economy through various ways including wealth transfer from oil buyers to producers, increase in the goods and services production and the effect on inflation, consumer confidence, and financial markets.Based on a study by Gogineni (2008), all industries are not equally dependent on oil. This assumption is due to the lack of articles expounding the effect of oil prices on the returns of non-oil-intensive industries. On the other hand, Bjornland (2009) argues that higher oil prices generally represent an immediate movement of wealth from oil importers to oil exporters. She stressed that the medium to long term effect hinges mainly on what the government in the oil producing countries do with the additional income. In instances when this income is utilized in the purchase of goods and services in their country, higher oil prices will produce higher level of activity which results in improved stock returns. Udegbunam and Eriki (2001) revealed in their study that the oil price volatility has no significant effect on stock price while El-Sharif, Brown, Burton, Nixon and Russell (2005) investigated the oil price changes-stock returns association in the U.K. oil and gas sector and revealed the relationship to be significantly positive. In addition, Driesprong, Jacobsen and Maat (2008) carried out an examination of whether oil prices’ changes predict stock returns of 48 countries through market data. The findings revealed that the sensitivity those individuals who are out of work, but are prepared to provide their services for payment; they are available to work and are searching for work. Unemployment has its advantages as well as its advantages. The former includes its assistance in averting uncontrollable inflation which negatively impacts the economic population with economic costs in the long-term. Nevertheless, the previous notion that full employment normally leads of the oil price changes is expected to differ from one country to another.Finally, Rahman and Ashraf (2008) revealed a positive and significant link between stock price and oil price in the short term in US. Based on Arouri and Rault’s (2009) findings, a co-integration of oil prices and stock markets in GCC countries exist, while the SUR results revealed that increase in oil prices has a positive effect on stock prices in countries with the exception of Saudi Arabia. Similarly, Narayan and Narayan’s (2010) study revealed a statistically significant positive effect of oil prices on Vietnam’s stock prices.e- Unemployment rateAccording to arbitrage pricing theory, assessment should be made of the systemic risk of an entire market and not of individual firms or micro-economies. An important marker of a region's financial health is its unemployment rate, which determines an economy's buying power and cash flow. According to the International Labor Organization (2011) "unemployed workers" are referred to as to local inflation has been negatively proven as current extensive global trade has been shown to be capable of continuing the supply of low-priced goods also in situations when local employment rates rises to nearly full employment.Another view of unemployment advantage and disadvantage is evidenced by the study conducted by Boyd, Liu and Jagannathan (2005). The authors revealed that normally, unemployment increase is good news for stocks during economic expansion while it is bad news during economic contractions. On the contrary, reports of unemployment reflect future interest rates, equity risk premium and corporate earnings. With regards to stocks, information concerning interest rates is stressed during expansions while future earnings information is highlighted during contractions. In their study, the authors explored the effects of fluctuating unemployment rates on the stock market and revealed that an increasing unemployment rate during recessions negatively affects stock market prices by driving the numbers down. On the other hand, during economic expansion, a rise in unemployment helps markets by driving the numbers up. From another point of view, Türsoy, Günsel and Rjoub (2008) revealed that unemployment has no significant impact on stock returns on Istanbul Stock Exchange (ISE) while Shiblee (2009) found unemployment to have a weak influence on most companies in the U.S.
4. Data Collection and Research Method
- 120 data for every variable in the period from January 2001 until December 2010 were obtained from international financial statistics (international monetary fund) and Kuwait economy reports in addition to Thomson Reuters DataStream.Descriptive analysis, Correlation, Unit root test, co-integration test, Granger causality test, vector auto regression (VAR) Model test and Variance Decomposition Analysis respectively are used to analysis the data. The names and symbols of variables are as follows:KSR: Kuwait index returnINF: Inflation (CPI)INTR: Lending interest rate MS: Money supply (M2) OP: Oil prices UNMR: unemployment rate
5. Empirical Findings and Discussion
5.1. Descreptive Analysis of Variables
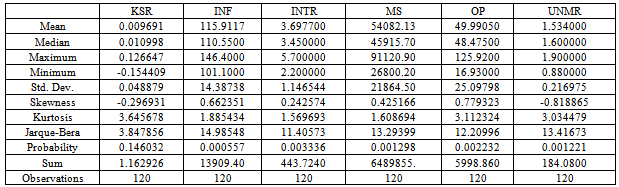
- The figures in the next page present a selection of key trends in Kuwait’s economy and Kuwait stock markets.A summary of the variables descriptive statistics is depicted in Table 1. Included in the table are values for sample mean, standard deviation, skewness and kurtosis, and the Jacque-Bera statistic and p-value. The KSR high standard of deviation in light of the mean indicates high volatility in the stock market. Based on the p-values, all variables are that normally distribution except of KSR. Moreover, all the variables are positively skewed with the exception of KSR and UNMR.Correlation matrix of five macro-economic indicators and stock returns computed over 10 years shows that the correlation between independent variables and the dependent variable is quite low. The independent variables have a strong correlation among themselves. The highest and significant correlation recorded is 0.988 which is obtained for relationship between inflation and money supply and the lowest correlation recorded is 0.25 which is obtained for relationship between interest rate and oil price.
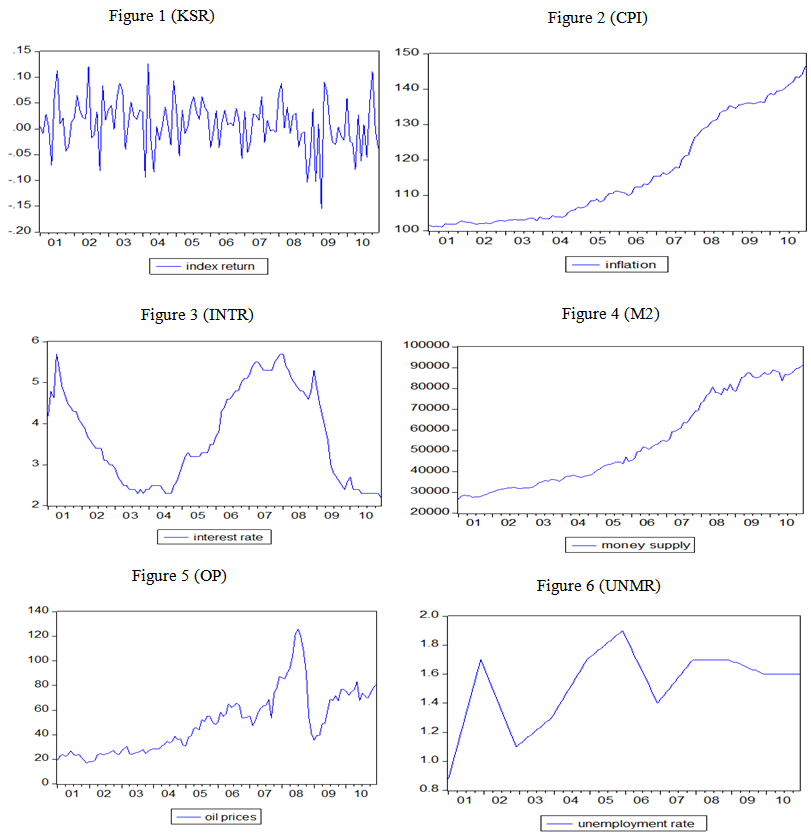 | Figure 1-6. Summary statistics for all variables |
|
5.2. ADF Unit Root Test
- Majority of the macro-economic time series indicate unit roots resulting from stochastic trends and hence, the augmented dickey-fuller (ADF) test is employed to see if the time series contain unit roots.The results revealed that KSR and UNMR were stationary at levels. On the other hand, INF, INTR, MS and OP were revealed to be non-stationary at levels although they become following the first differencing at a significant level of 1%.
5.3. Determination of Appropriate Lag Lengths
- The present study employed the Johansen Co-integration test to examine if a long run relationship exists between variables. Prior to the test, appropriate lag lengths to be used in VAR model are determined. Based on this test, the appropriate lag lengths within FBE, AIC, SC, and HQ is 2. 3
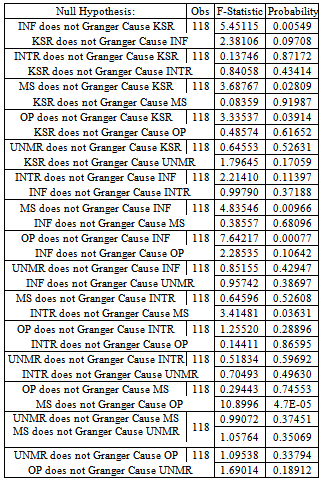
5.4. Granger Causality Test
|
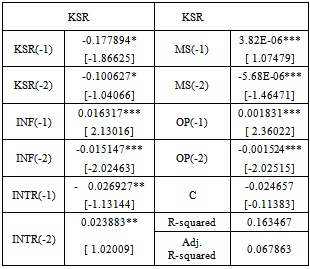
5.5. VAR Model Test Results
- The results obtained from the VAR model indicate significance at 1%, 5% and 10% in all lag lengths as depicted in Table 3. According to the results, in the periods of January 2001 and December 2010, KSR showed an increase of 1% which leads to a decrease of 0.177% a month later and a decrease of 0.1% two months later. It also revealed an increase of 1% in INF which leads to an increase of KSR at a rate of 0.016% a month later, and an increase of 1% in INF leads to a decrease of 0.015% two months later. Moreover, the following trends are also evident; an increase in INTR by 1% leads to an decrease in KSR by 0.027%; an increase of 1% in INTR leads to an increase in KSR by 0.024% 2 months later; an increase of 1% in MS leads to an increase in KSR by 0.0000038% a month later and a decrease in KSR by 0.00000568% two months later; and finally, an increase of 1% in OP leads to an increase in KSR by 0.0018% a month later and a decrease in KSR by 0.0015% two months later.
|
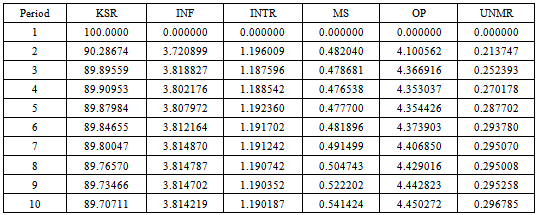
5.6. Variance Decomposition
|
6. Conclusions and Further Research
- This study investigated the effect of macro-economic indicators (inflation, interest rate, money supply, oil prices and unemployment rate) and stock returns in Kuwait stock market. Hence, tests including Unit Root Test, Granger Causality Test, Co-integration Test, VAR Model Test and Variance Decomposition Analysis are employed.Stock return and unemployment rate are stationary at level values and inflation rate, interest rate, money supply and oil prices are stationary at first difference value. Johansen-Juselius multivariate cointegration tests shows that there are three co-integration vectors between variables. The Granger causality test postulates a bi-directional causality between (MS) and (KSR), (OP) and (KSR), (MS) and (INF), (OP) and (INF) and (INTR) and (MS). Based on VAR model test, a positive association exists between inflation, money supply and oil price in 1-month time and stock return in Kuwait stock market, there is a negative relationship between interest rate in 1-month time and stock return in Kuwait stock market. There is a positive relationship between interest rate in 2-month time and stock return in Kuwait stock market and finally, there is a negative relationship between inflation, money supply and oil prices in 2-month time and stock return in Kuwait stock market. The results from the Variance decomposition indicate that the short run (2 months) stock returns are impacted by their shocks and the long run (10 months) by the oil prices.Further research is needed to determine the effect of macro and microeconomic variables in this market and compare the results with other markets in GCC and developing countries in order to investigate this effect on specific sector.
Notes
- 1. Kuwait Economic Report , February 20112. Keynesian economics, better known as Keynesianism and Keynesian theory) refers to a macro-economic theory which has its basis on the postulations of a 20th century English economist, John Maynard Keynes.3. FPE: Final prediction errorAIC: Akaike information criterionSC: Schwarz information criterionHQ: Hannan-Quinn information criterion