-
Paper Information
- Previous Paper
- Paper Submission
-
Journal Information
- About This Journal
- Editorial Board
- Current Issue
- Archive
- Author Guidelines
- Contact Us
American Journal of Chemistry
p-ISSN: 2165-8749 e-ISSN: 2165-8781
2015; 5(3A): 56-60
doi:10.5923/c.chemistry.201501.09
Physical and Chemical Property Changes of Coffee Beans during Roasting
 Abstract
 Reference
 Full-Text PDF
 Full-text HTML
A. M. Fareez Edzuan, A. M. Noor Aliah, H. L. Bong
Department of Mechanical and Manufacturing Engineering, Universiti Malaysia Sarawak
Correspondence to: A. M. Fareez Edzuan, Department of Mechanical and Manufacturing Engineering, Universiti Malaysia Sarawak.
| Email: |  |
Copyright © 2015 Scientific & Academic Publishing. All Rights Reserved.
The desired aroma and flavour of coffee are developed during roasting process where the coffee beans undergo a series of complex chemical reactions leading to the changes of physical and chemical properties. In order to study the correlation between physical and chemical properties of the coffee beans during roasting process, 100 g of Timor Arabica coffee beans were roasted and sampled at 2 minutes interval roasting period. The physical changes such as weight loss, surface temperature, colour and cracking sound as well as spectral characteristics changes by using FTIR spectrometer were investigated. The timing for the spectral characteristics apparent changes correspond well with the first and second cracking sound noted at 6 and 10 minutes roasting period, respectively. It can be assumed that important chemical compounds, which may be good indicators for coffee roasting degree, appeared near the optimum roasting period. The physical and chemical properties changes data may be utilized to develop an online monitoring device for roasting degree doneness.
Keywords: Coffee roasting, Roasting degree evaluation, Chemical and physical compositions, Temporal changes, FTIR
Cite this paper: A. M. Fareez Edzuan, A. M. Noor Aliah, H. L. Bong, Physical and Chemical Property Changes of Coffee Beans during Roasting, American Journal of Chemistry, Vol. 5 No. 3A, 2015, pp. 56-60. doi: 10.5923/c.chemistry.201501.09.
Article Outline
1. Introduction
- Coffee is the second most traded commodity only after crude oil where statistics by International Coffee Organization revealed 19.1 billion USD worth of green coffee was exported for year 2012. In recent years, appreciation of high quality gustatory coffee beverage is increased as consumers are no longer content with commercial standard instant coffee. Although green coffee beans contain complex chemical compositions, it has an unattractive aroma and taste by itself. The pleasant coffee aroma is developed during roasting process that can further be divided into three consecutive stages which are drying, roasting and cooling stage. During these stages, the bean will undergo series of reactions leading to changes of chemical and physical properties [1]. Coffee roasting is a complex heat transfer process, where coffee beans are subjected to a steady weight loss, increase of volume and consequently decrease of density during entire roasting process [2]. In addition, coffee beans will undergo major changes such as colour, pH level, flavour and aroma. The drying, roasting and cooling stages need to be precisely controlled to avoid excessive roast that will alter product quality [3].Nevertheless, the roasting process is one of the most important step to bring out the pleasant aroma and taste flavour from green coffee beans. Most of coffee roasting company still dependant on highly experienced roast master to roast and evaluate the coffee roasting degree from sensory aspects only such as colour and aroma. Hernandez et al. successfully employed online image analysis assessment to replicate the roast master’s method of evaluating roasting degree by its brightness or colour [4]. However, Franca et al. had roasted green coffee beans with two different roasting profiles, such as high temperature-shorter roasting period and low temperature – longer roasting period. It was reported that the volatile profiles and sensory taste for the beans undergo different roasting profiles were different even though the colour of the end products were exactly the same [5]. Franca et al. and Farah et al. used high performance liquid chromatograph (HPLC) to observe chemical compounds in both green coffee beans and roasted coffee beans. Several chemical compounds such as caffeine, trigonelline and 5-chlorogenic acids have been identified as major coffee flavours contributors or possible indicators for a cup quality evaluation [6, 7]. Atsushi et al. develop a unique method to evaluate brewed instant coffee characteristics by using Fourier transform infrared (FTIR) device. It was reported that the spectral behaviour of brewed coffee due to pH and temperature changes could be spectroscopically and quantitatively explained by using FTIR [8]. Dutra et al. used gas chromatograph to study the volatile profiles of roasted coffee bean gases sampled at 2 minutes interval of roasting period. Different volatile profiles were observed by different period samples but no concrete explanation can be made from the data obtained [9]. In order to produce a consistent supply of a quality coffee cup, the roasting knowledge such as temporal changes of coffee beans during roasting process need to be investigated further. This study observes the relationship between physical properties and chemical properties changes of Timor Arabica coffee beans during roasting process.
2. Materials and Methods
2.1. Coffee Samples
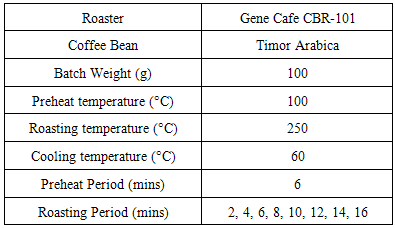
- Timor Arabica green coffee beans were roasted by hot air roasting method. The roasting conditions were set up at three stages where first the beans were preheated at 100°C for 6 minutes to prevent surface burning, then it were roasted at 250°C from 2 to 16 minutes and finally air-cooled until the temperature dropped to 50°C to completely stop the roasting process.
2.2. Coffee Roaster
- A hot air flow rotational coffee roaster (Gene Cafe CBR-101) was used to perform roasting experiment. The roaster is equipped with timing / temperature setting system and air cooling system with optically assessable design. The experimental conditions were shown in Table 1.
|
2.3. Physical Properties
- High precision weighing scale was used to measure the beans weight loss during roasting process. The surface temperature of the beans was taken by a thermograph camera. The colour and notable physical of roasted coffee beans were visually observed during and after roasting.
2.4. Sensory Test
- Two experienced baristas performed the sensory test widely known as cupping test to evaluate cup quality of the roasted beans based on its aroma, body, acidity and flavour.
2.5. FTIR Spectroscopy Analysis
- The spectroscopy characteristics changes in roasted beans undergo roasting process were analysed by using Shimadzu FTIR spectrometer. The coffee beans were grinded just before brewing to ensure its quality. 5 ml of each brewed sample’s FTIR spectrum was recorded between 4000 and 400 cm-1.
3. Results and Discussions
3.1. Physical Properties
- Figure 1 showed the colour variations of coffee beans sampled at two minutes interval during the roasting process. A quality dark roasted coffee from a chain coffee shop was used as a benchmark for visual evaluation. The colour of the coffee beans turned darker as it were being roasted and oil spotting on the beans surface became apparent from 10 minutes roasting period. At around 6 minutes and 10 minutes period, first and second cracking sounds were noticed, respectively.
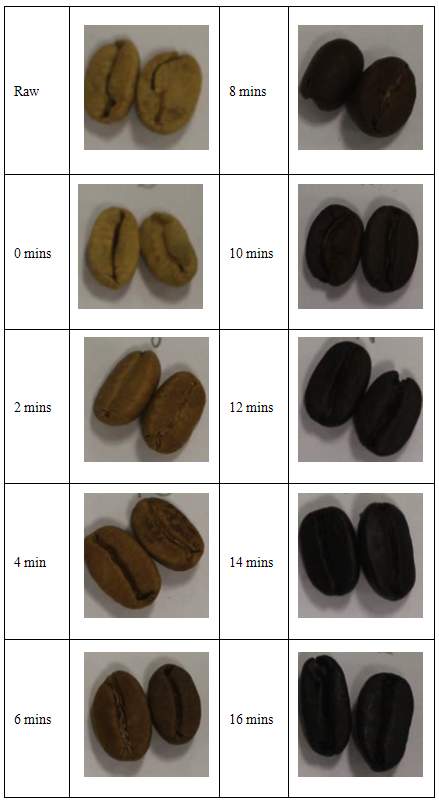 | Figure 1. Timor Arabica coffee beans colour variations during roasting process |
 | Figure 2. Timor Arabica coffee beans weight loss during roasting process |
 | Figure 3. Timor Arabica coffee beans surface temperature during roasting process |
3.2. Sensory Test
- The roasted beans were tested by two experienced baristas to determine its cup quality. The sample of Timor Arabica beans roasted at 16 minutes was brewed by using a press type coffee maker with a standard cupping procedure. Figure 4 showed the sensory test assessment where the sample achieved excellent remarks for aroma, body and flavour. This result indicates a high overall quality for the coffee beans roasted in this experiment.
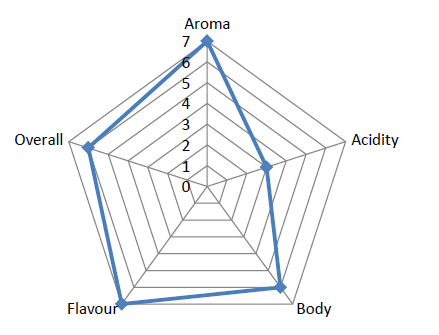 | Figure 4. Cup quality assessment chart for Timor Arabica coffee beans sampled at 16 minutes roasting period |
3.3. FTIR Spectroscopy Analysis
- According to The Specialty Coffee Association of America (SCAA), the coffee aroma test can be done on dry and wet ground coffee beans, where the aroma characteristics will become more apparent in wet method. Comparison was made between dry and wet method for Timor Arabica coffee beans sampled at 10 minutes period to study their spectral characteristics difference as shown in Figure 5. Broad region of O-H functional group at 3000 to 4000 cm-1 corresponds to water can only be observed in wetted ground beans sample. It was noted that the wet method produce a smooth spectroscopy with a peak at 1640 cm-1 region while the dry method produced relatively small peaks that appear in several regions. These results may suggested that several chemical compound linkages are broken and formed when the grounded beans were brewed.
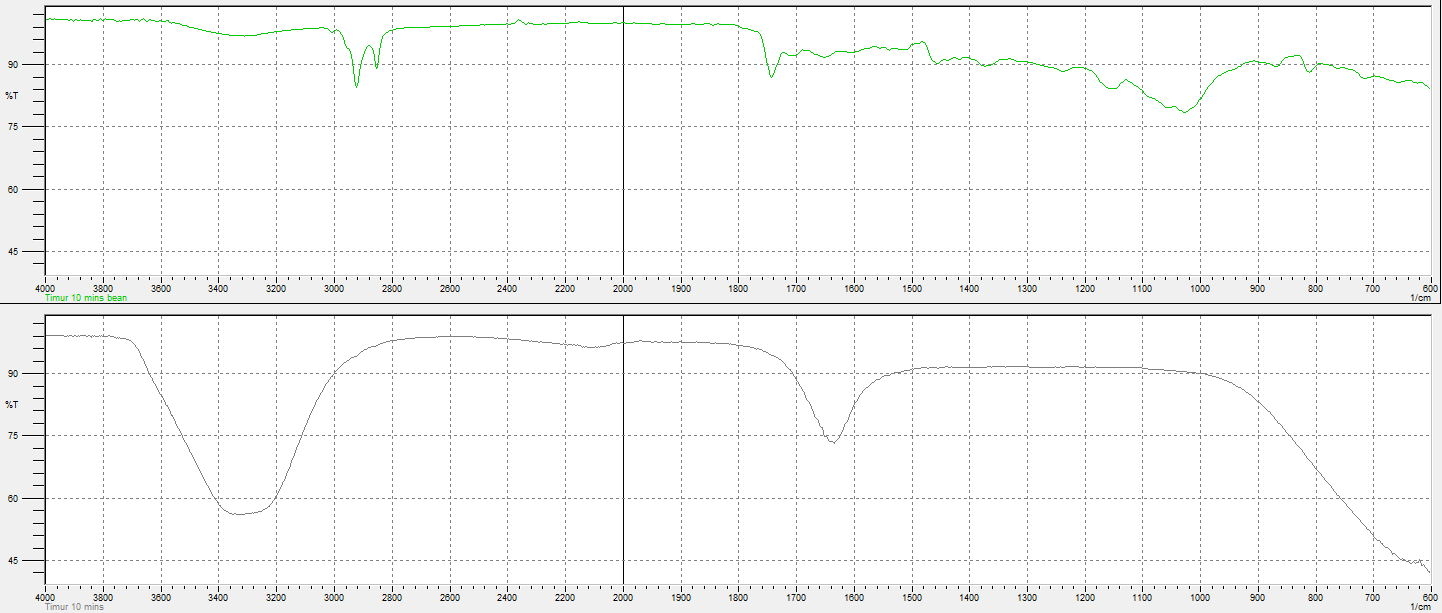 | Figure 5. Spectroscopy of dry (top) and wet (bottom) Timor Arabica grounded coffee beans sampled at 10 minutes period |
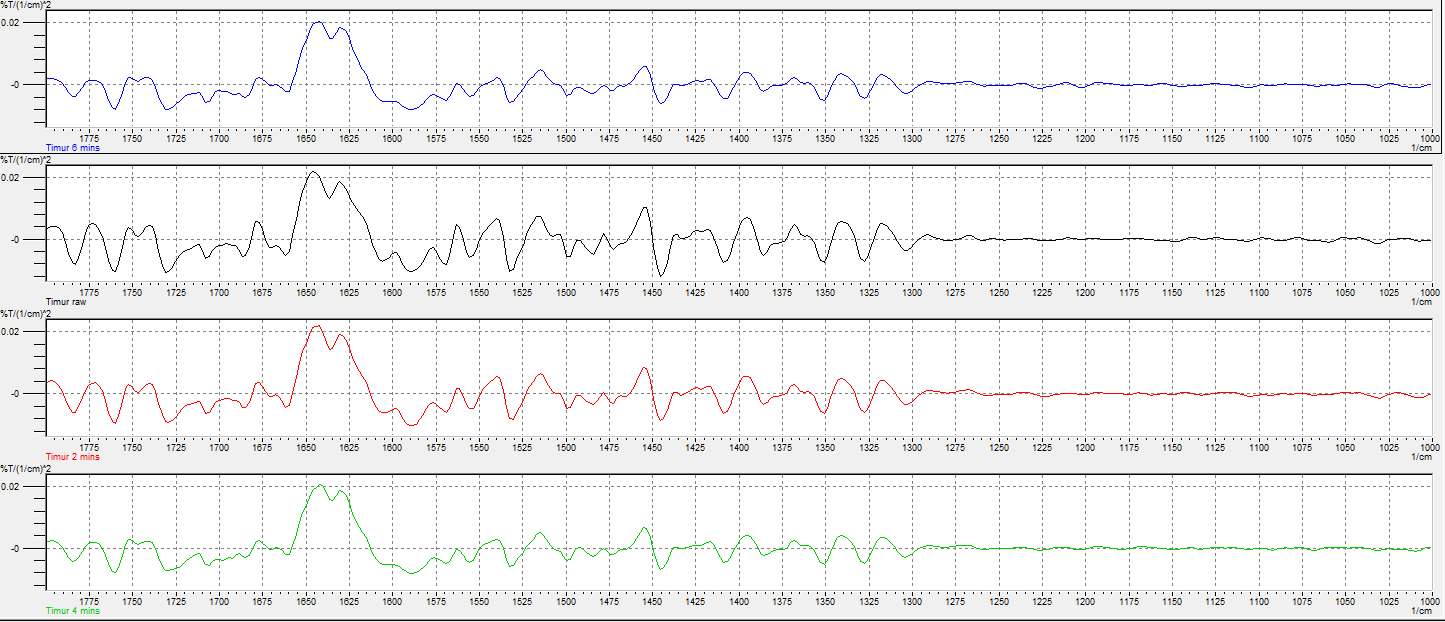 | Figure 6(a). Second derivative spectroscopy of Timor Arabica coffee beans brewed sampled at 6 minutes (top), raw (second top), 2 minutes (second bottom) and 4 minutes (bottom) |
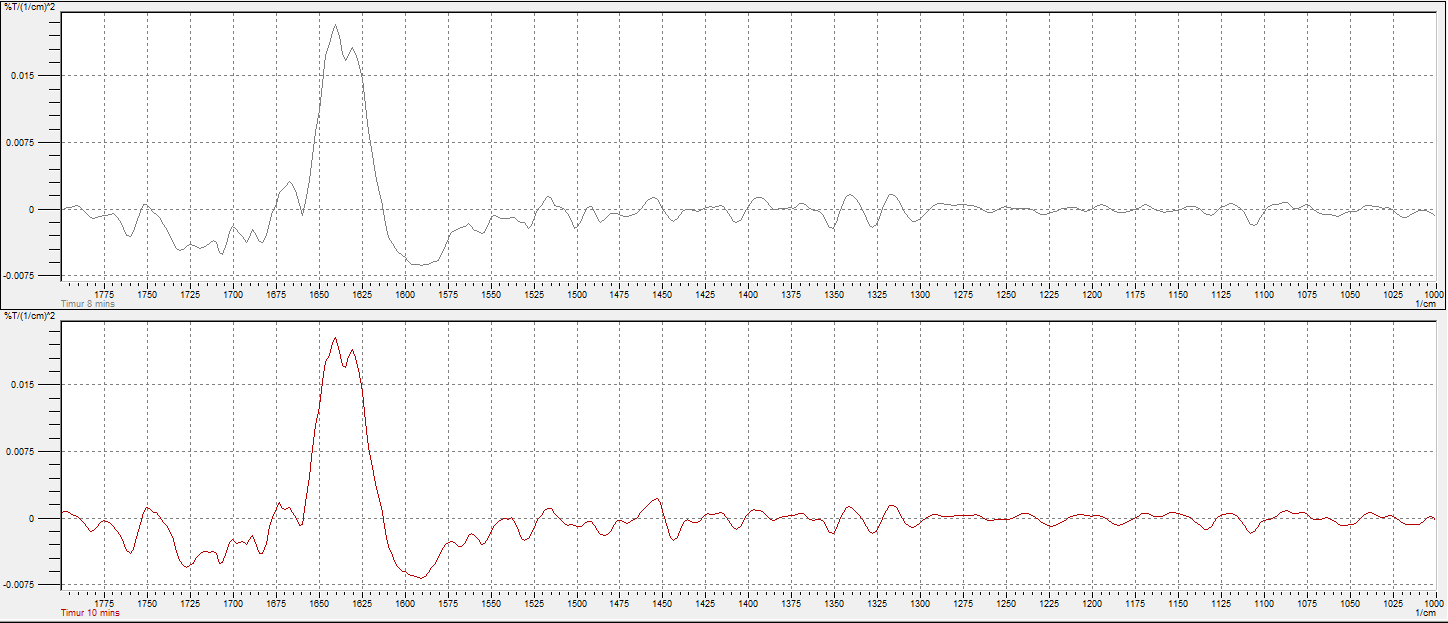 | Figure 6(b). Second derivative spectroscopy of Timor Arabica coffee beans brewed sampled at 8 minutes (top) and 10 minutes (bottom) |
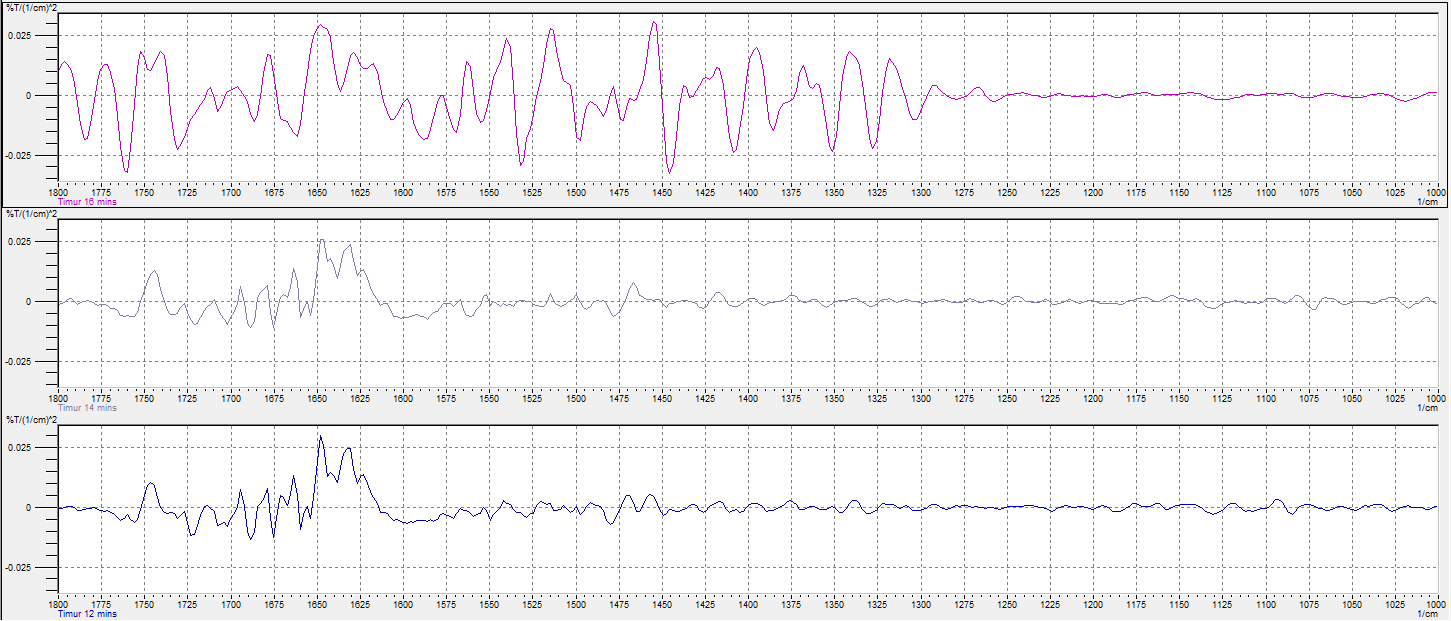 | Figure 6(c). Second derivative spectroscopy of Timor Arabica coffee beans brewed sampled at 16 minutes (top), 14 minutes (middle) and 12 minutes (bottom) |
4. Conclusions
- Timor Arabica coffee beans were roasted in this study and the temporal variations on the physical properties (colour, weight loss and surface temperature) and FTIR spectroscopic characteristics during roasting process were evaluated. Apparent changes of spectral characteristics are observed after the first cracking sound at 6 minutes period (207°C) and second cracking sound at 10 minutes period (219°C), which may indicate the emergences of important compounds when the roasting period is close to the optimum roasting degree. An online method to evaluate the coffee roasting degree can be proposed based on the beans physical properties and spectroscopic data. Further study on the important chemical compounds identification and quantification from the FTIR results need to be investigated.
ACKNOWLEDGEMENTS
- The author would like to express their gratitude to Universiti Malaysia Sarawak especially to The Chemical and Energy Sustainability Department’s technical staff for providing the support to conduct this research. This study is funded under Dana Pembudayaan Penyelidikan (RAGS), Ministry of Education Malaysia.