Li Wen Chew1, Mohd Shahbudin Masdar2, Siti Kartom Kamarudin2
1Department of Chemical and Process Engineering, Universiti Kebangsaan Malaysia, UKM Bangi, Selangor, Malaysia
2Fuel Cell Institute, Universiti Kebangsaan Malaysia, UKM Bangi, Selangor, Malaysia
Correspondence to: Mohd Shahbudin Masdar, Fuel Cell Institute, Universiti Kebangsaan Malaysia, UKM Bangi, Selangor, Malaysia.
| Email: |  |
Copyright © 2015 Scientific & Academic Publishing. All Rights Reserved.
Abstract
Biomass has been extensively studied as one of the promising sources for producing biogas in Malaysia such as bio-methane and bio-hydrogen. The fermentation process using bioreactor was one of the technologies to produce bio-hydrogen, which also contained mainly carbon dioxide (CO2) through biological pathway. For fuel cell application, such as polymer electrolyte membrane fuel cell (PEMFC), high purity hydrogen (H2) up to 99.99% was required to generate the electricity. The presence of CO2 in H2 in a fuel cell will cause CO2 poisoning and affect its performance. Hence, the purification of H2 from bio-hydrogen was desired to ensure appropriate concentration of H2 was achieved for supplying in a fuel cell. Therefore, this study was focused on the absorption technique for purifying the H2 from mixed CO2 based on the concentration of sodium hydroxide (NaOH) as an absorber solution and the inlet concentration of CO2. Besides, most of the previous studies done on the performance of PEMFC mainly focused on the effect of temperature, pressure, pH and type of catalyst in fuel cell. The study on the effect of H2 flow rate on the performance of PEMFC was lacking and the optimum flow rate of pure H2 in PEMFC has yet to be identified. Since the cost of pure H2 was high, fuel cells that operated at optimum H2 flow rate for maximum performance were able to prevent H2 wastage and reduce the fuel cell operating cost. Moreover, PEMFC was very sensitive to the presence of impurity such as CO2 in which it will decrease the performance and lifespan of the platinum catalyst in fuel cell. In addition, issues such as the mechanism of CO2 impurity on the performance of PEMFC and the impact of CO2 accumulated in fuel cell on the cell voltage and efficiency of fuel cell were always questionable. Furthermore, many previous researches done only focused on the effect of carbon monoxide (CO) and hydrogen sulfide (H2S) on the performance of PEMFC. Hence, the study was also conducted to investigate the operation of PEMFC using different H2 flow rate and the effect of CO2 impurity in H2 fuel to their performance. The effect of absorption conditions, H2 flow rate and CO2 impurity were discussed on the basis of the PEMFC performances. The power increased with the increasing H2 flow rate up to 200 ml min-1 for 14W power generation. Meanwhile, the CO2 impurity in H2 fuel would reduce the PEMFC performance and the degradation of stack power increased with increasing CO2 concentration.
Keywords:
PEMFC stack, Bio-hydrogen, Carbon dioxide, Absorption, Sodium hydroxide, Flowrate, Impurity
Cite this paper: Li Wen Chew, Mohd Shahbudin Masdar, Siti Kartom Kamarudin, Purification of Bio-Hydrogen Using Absorption Techniques and the Effect of CO2 Impurity on the PEMFC Performance, American Journal of Chemistry, Vol. 5 No. 3A, 2015, pp. 24-34. doi: 10.5923/c.chemistry.201501.04.
1. Introduction
Nowadays, H2 has been regarded as a clean source of energy as it produces almost no pollution [1]. Biomass was expected to emerge as the best source of hydrogen in the coming decades as it can produce large quantities of bio-hydrogen. Although gasification of biomass will mainly produces H2 and CO2 gas mixture, but it can be controlled to optimize the production of H2 component and appeared to be a much cost effective in economic scale. In addition, microbial strains of bacteria that were found can also maximized and increased the rate of production of H2 in bioreactor system. Furthermore, the bioreactor system was also integrated into polymer electrolyte membrane fuel cell (PEMFC) system to supply H2 directly across the fuel cell for power generation. Therefore, nowadays many researchers have focused for the application of biomass as a source of bio-hydrogen production [2]. However, the presence of CO2 in H2 in a fuel cell would reduce the fuel cell performance and could degrade the catalyst activity. Janssen and Lebedeva reported that the existing of CO2 in reformate fuels in concentrations up to 25%, can have a detrimental effect on the fuel cell performance [3]. Therefore, the effect of different concentration of CO2 to the performance of fuel cell is desired to ensure minimum detrimental effect on the fuel cell [4]. Hence, the upgrading (separation and purification) of H2 has become a key issue since only purified H2 is used for power generation specifically for fuel cell application. The absorption technique was used in a number of industrial processes which includes the production of oxygen enriched air, separation of CO2 from atmospheric air and purification of H2. Basically, chemical solvent absorption is based on reactions between CO2, and basic absorbents such as sodium hydroxide (NaOH) or potassium hydroxide (KOH) to convert them into a carbonate salt. This technique is the most favorable because the process is simple, proven and continuous. Besides, absorption technique also appear to be the cheapest and most convenient CO2 disposal method as it can be carried out under environmental conditions such as temperature or humidity. Another advantageous characteristic of absorption is that it can be reversed by sending the CO-rich absorbent to a desorber where the temperature is raised. The regenerated absorbent is then returned to the absorber thereby creating a continuous recycling process [5, 6]. In case of H2 production by fermentation process, bio-hydrogen gas produced from biomass usually contain large amount of CO2 impurity. Besides, PEMFC is very sensitive to impurity such as CO2 which will degrade the performance of fuel cell and decrease its lifespan. Therefore, this study would focus on the effect of CO2 impurity on the basis of stack performance. Moreover, this study focused on the performance of NaOH absorption technique in the separation of bio-hydrogen mixed with CO2 and the effect of flowrate and purity of H2 on the fuel cell performance. Therefore, the finding of the study could be used as a basic knowledge in order to integrate the bioreactor and fuel cell system including the purification unit of hydrogen for power generation system.
2. Experimental
The study was divided into two categories where the first category was on the absorption rate of CO2 using NaOH solution, while the second category was the effect of flowrate and purity of H2 gas on PEMFC stack operation and long term performance.
2.1. CO2 Absorption Technique Using NaOH Solution
Different concentration of NaOH solution was prepared through dilution method in which solid NaOH was diluted with distilled water. A range of 1M to 5M of NaOH solution was prepared by using the standard solution formulas (1) and (2) as shown below: | (1) |
 | (2) |
The model gases of CO2 mixed with air were used to adjust the concentration of CO2 and to replace the real concentration of CO2 produced from fermentation process. To standardise the reading on the CO2 Analyzer, atmospheric air was being pumped into the CO2 Analyzer at the beginning of each test. The CO2 Analyzer showed a reading of the initial CO2 concentration at a range of 0.030% to 0.032% which represent its concentraion in atmospheric air. In this experiment, air and CO2 were mixed in a side arm beaker which contain NaOH solution before entering into the CO2 Analyzer. The experiment was run for 1 h at room condition. Two set of data were produced in the experiment. The first set of data was to obtain the CO2 absorption rate of NaOH solution at different concentration range from 1M to 5M in which the inlet concentration of CO2 was fixed at 5%. The second set of data was to obtain the CO2 absorption rate of fixed 5M concentration of NaOH solution at different inlet CO2 concentration. Fixed 300 ml min-1 air flowrate and 60ml of fresh NaOH solution were used in all the test to ensure linearity of the experiment. The experimental set up in which air and CO2 were mixed before entering CO2 Analyzer as shown in Figure 1. 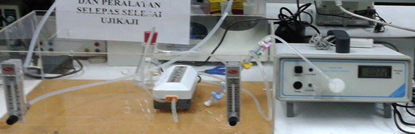 | Figure 1. Experiment set up for the CO2 absorption technique using NaOH solution |
2.2. Effect of Flowrate and Purity of Hydrogen Gas on PEMFC Stack Operation and Long Term Performance
By using the open cathode PEMFC stack from Horizon Fuel Cell, model FCS-B20, the stack was supplied using pure H2 (99.99%) gas at 140 ml min-1 for 10 min for pre-treatment mode. To study the effect of H2 flowrate, pure H2 gas at a flowrate of 50 ml min-1 to 460 ml min-1 was supplied into the anode and the cathode was exposed to the ambient air. Meanwhile, the PEMFC stack was connected to a fuel cell monitor 3.0 (H-TEC) using a common electrical wire in order to measure the performance of stack during the operation. The power generation was conducted using linear sweep voltage (LSV) and at fixed 9.0 V over 30 min. For the second experiment, it was carried out to investigate the effect of different concentration of CO2 impurity in H2. Model gases of CO2 and H2 were used to replace the real gases produced from bioreactor. Pure CO2 was mixed with pure hydrogen in one chamber (Duran bottle) to vary the concentration of CO2 by adjusting their flowrates as shown in Figure 2 (a). The concentration of mixed CO2-H2 was measured using CO2 Analyzer to make sure desired concentration have been achieved. Then, the mixture of CO2 and H2 was supplied into the anode at a constant rate of 200 ml min-1 and the cathode was exposed to the ambient air. Similar procedures were used to study the effect of CO2 impurity by using LSV mode and fixed 9.0 V over 30 min. Figure 2 (b) shows the experiment set up of the PEMFC performance test. Meanwhile, a long-term test performance for PEMFC stack was conducted over 2 h operation using pure H2 and 10% to 60% CO2 concentration.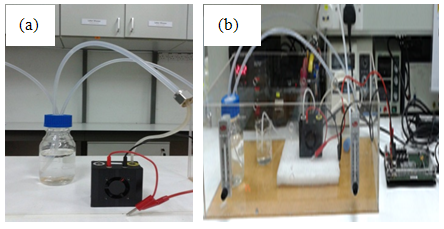 | Figure 2. PEMFC stack used in this study (a) mixture of CO2 and H2 in Duran bottle (b) experiment set up of the PEMFC performance test |
3. Results and Discussion
3.1. Effect of Absorption Rate at Different Concentration of NaOH and CO2
Figure 3 shows the profiles of the CO2 concentration at the outlet of absorber using CO2 analyzer for different concentration of, Figure 3(a) NaOH used with fixed 5% CO2 concentration at inlet, Figure 3 (b) CO2 at inlet with fixed 5M NaOH concentration; for 60 min. For all the cases in Figure 3, either at different NaOH concentrations or different CO2 concentrations at the inlet, the rate of absorption of CO2 decreased throughout the period of operation. However, the amount of CO2 absorbed increased with time. According to Figure 3 (a), as the concentration of NaOH increase, the decrease in the rate of absorption becomes smaller. At 60 min, it also shown that at higher concentration of NaOH and higher CO2 concentration at the inlet, the amount of CO2 absorbed was higher. It can be understood that an increase in the concentration of CO2 at inlet led to an increase in the amount of CO2 absorbed as well as the rate of CO2 absorption. It is due to more amount of CO2 in contact with the NaOH solution surface area.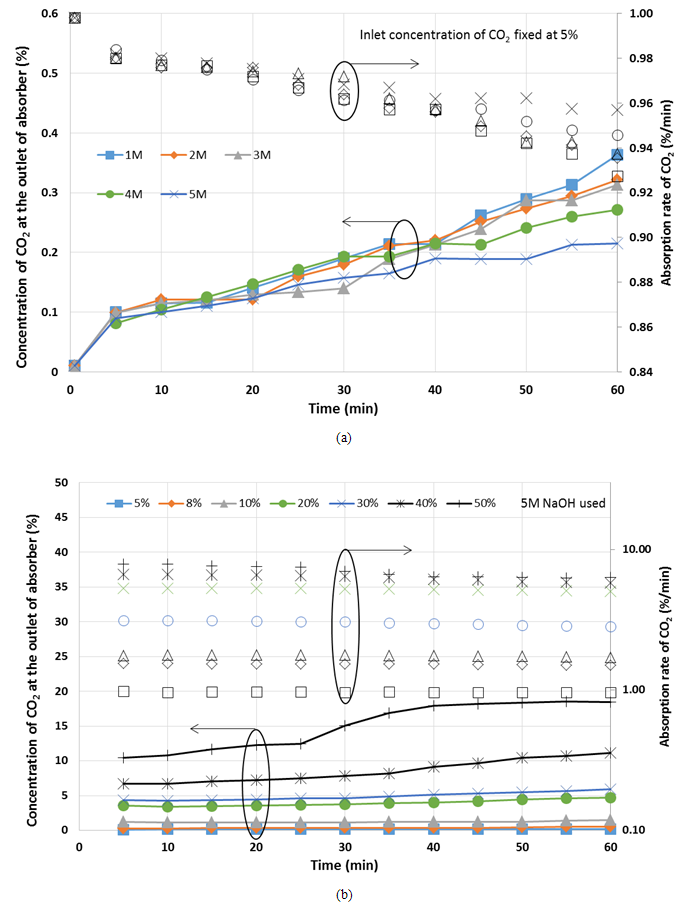 | Figure 3. Profile of CO2 absorbed using absorber (a) different concentration of NaOH, (b) different inlet concentration of CO2, during 60 min |
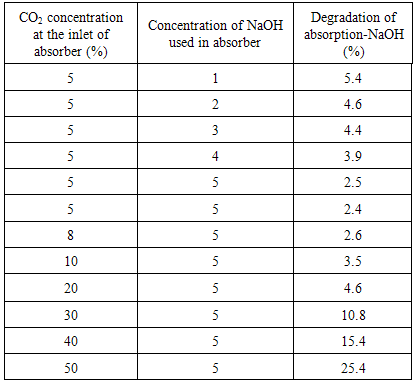
Furthermore, Table 1 shows the absorption degradation from beginning until 60 min operation for different concentration of NaOH used and different CO2 concentration at the inlet. From the table, it is clearly shows that the absorption degradation decreased with the increasing of NaOH used while increased with the increasing of CO2 concentration at the inlet of absorber.Table 1. Rate of absorption of CO2 after 60 min using different inlet concentrations of CO2
 |
| |
|
For the absorption of CO2, it was initially high when a high concentration of NaOH was present in the solution and decreased until all of the NaOH had been converted to sodium bicarbonate (Na2CO3). NaOH solution absorbs CO2 by chemical reaction in two steps [6]: | (1) |
 | (2) |
Based on equations (1) and (2), one half of CO2 is absorbed in each step, however step (1) takes place faster than (2) [6]. For higher concentration of NaOH, more free hydroxide ion is available for reaction with CO2, hence more CO2 is absorbed and the decrease of rate of absorption is slower. For lower concentration of NaOH, less hydroxide ion is available for reaction with CO2, the solution is rapidly saturated with CO2 causing the rapid drop in amount of CO2 absorbed. Therefore, the higher concentration of NaOH used resulted in a higher amount of CO2 absorbed.
3.2. Effect of Hydrogen Flowrate on PEMFC Performance
Horizon PEMFC stack was used to test the effect of H2 flowrate on the performance of the stack. Figure 4 shows the performance of PEMFC stack, Figure 4 (a) polarization curve; Figure 4 (b) stack power for different H2 flowrate from 50 ml min-1 to 140 ml min-1. Meanwhile, Figure 5 shows the maximum power of PEMFC from Figure 4 (b) at different H2 flowrate with additional data for high H2 flowrate up to 460 ml min-1. 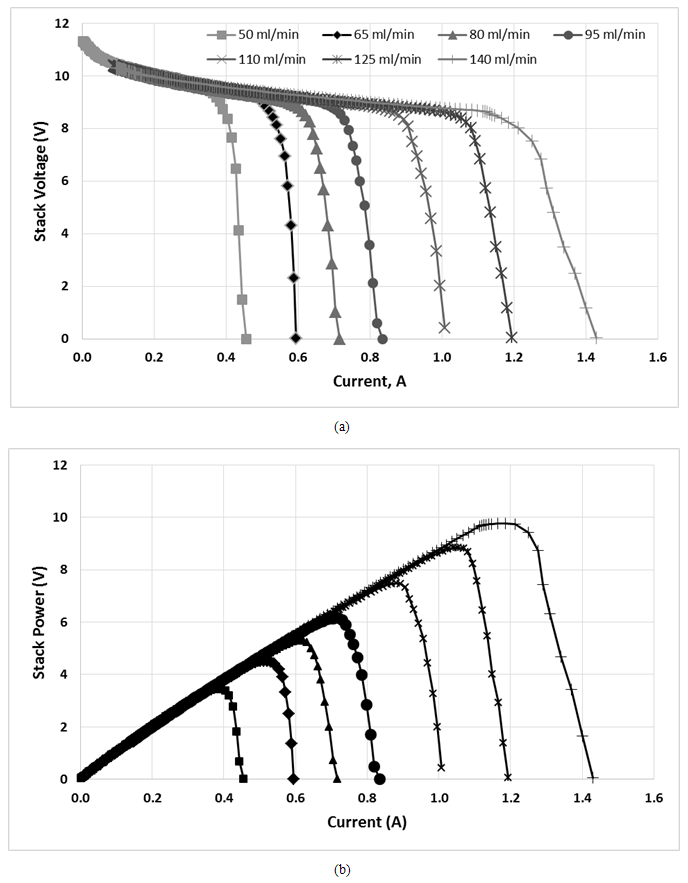 | Figure 4. Performance of PEMFC (a) polarization curve (b) power of stack, at different H2 flowrate |
Based on Figure 4 and Figure 5, the performance of PEMFC stack increased with the increasing of H2 flowrate. This trend was similar to that previous reported by Taymaz et al. They stated that the increase in the flowrate of H2 will increase the current of the cell and then increase power density [7]. It is easily understood that with increasing the flowrate, it will increase the H2 transport in anode as a reactant for anode reaction. The increase in power profile as the H2 flowrate increases from 50 ml min-1 to 200 ml min-1 is due to the relative humidity of the H2 which will ensure that the membrane remains fully hydrated to maintain good proton conductivity. 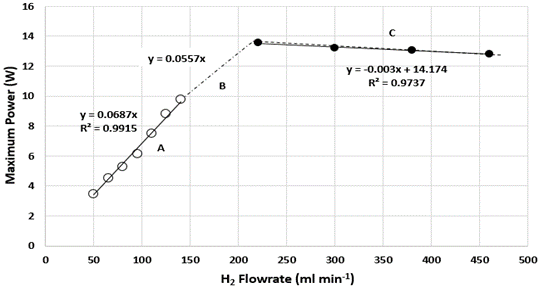 | Figure 5. Maximum power of PEMFC stack at different H2 flowrate |
Based on Figure 5, at point A in which the H2 flowrate is between 50-140 ml min-1, the rate of increase in the performance of PEMFC is the highest compared to point B in which the H2 flowrate is between 140-200 ml min-1. This can be shown in Figure as point A has a higher slope gradient compared to point B. However, at point C when the H2 flowrate exceed 200 ml min-1, the PEMFC performance start to decreased gradually. Hence, the optimum H2 flowrate for maximum performance in this PEMFC stack is 200 ml min-1. In Figure 5, 3 equations that relates the relationship of the H2 flowrate and maximum power achieved were generated. The first 2 equations obtained which are y=0.0687x and y=0.0557x can be used as a calculation reference to calculate the amount of H2 flow rate required, x, to achieve a specific power generation, y for different range of H2 flowrate. Meanwhile, at flow rates above 200 ml min-1, the performance of stack was slightly reduced as shown in the negative slope at Figure 5. The rate of degradation in the PEMFC performance could be represented by the equation y=-0.003x+14.174. The decrease in the performance of PEMFC could be due to convection effect. According to Song et al., excess amount of H2 gas may cause irreversible loss of performance due to large pressure differences in the fuel cell. Large pressure difference in the fuel cell can cause gas cross-over in single cell to occur through electrolyte or gas leakage by incomplete sealing at the edge of the cell. The increased in H2 partial pressure at high H2 flow rate induces pressure differences between the anode and the cathode sides, which may increase the gas cross-over rate. The gas cross-over effect was confirmed when H2 was found at the cathode which will react with oxygen to produce water due to catalytic effect of platinum on the cathode. Water was also observed in the exit anode gas which shows that oxygen cross-over occurred. Thus, it can be concluded that decrease in open circuit voltage (OCV) at high H2 flow rates is due to the increased gas cross-over rate. Moreover, polarization curve at high current density domain depend a lot on the H2 flowrate. At this region, when the H2 flow rate decreases, the cell voltage will also decrease. This is caused by an increase of concentration overvoltage caused by the deficiency of H2 supply to reaction site at anode. [12].Figure 6 shows the power profile of PEMFC stack with time for different H2 flowrate from 50 to 290 ml min-1 at constant 9V. Meanwhile, Figure 7 shows the power of stack with respect to H2 flowrate at constant 9V during 30 min PEMFC operation. Similar trend was obtained at fixed 9V which the power increased in increasing from 50 to 200 ml min-1 before decreased above this flowrate. 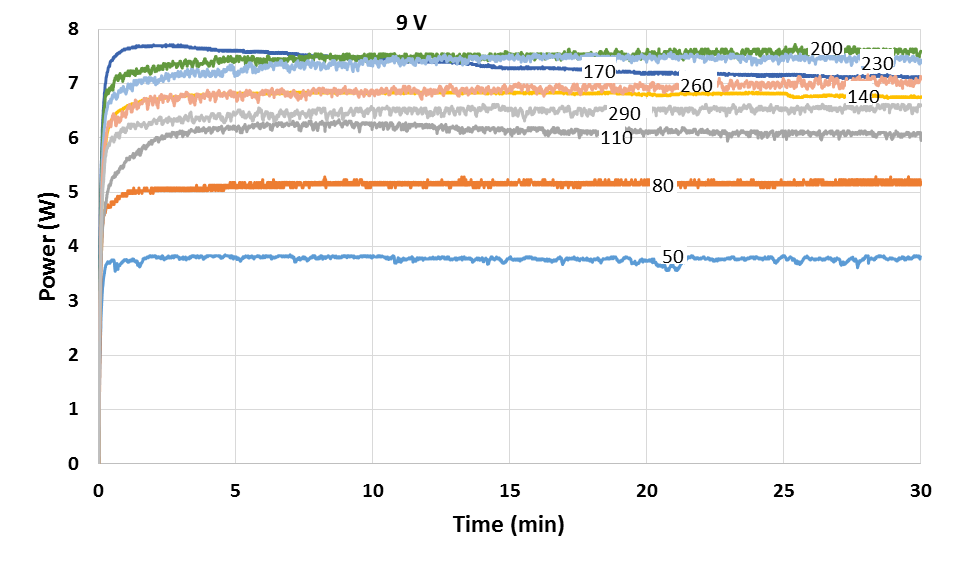 | Figure 6. Power profile of PEMFC with time for different H2 flowrate from 50 to 290 ml min-1 at 9V |
According to Ji M. et al., there are two factors that could contributed to the decrease in power profile of PEMFC at high H2 flowrate. First factor due to high H2 flow rate will increase the moisture content at the cathode side of the fuel cell through formation of water in the reaction. This may easily cause flooding in the fuel cell to occur. During flooding, the pores of the catalyst layer and the gas diffusion layer are flooded by excessive liquid water, resulting in higher mass transport resistance at cathode. This leads to instant increase in mass transport losses, particularly at the cathode. Therefore, the transport rate of the reactants to the catalyst active sites was significantly reduced. Excess water blocks the pores of the gas diffusion layer and thus prevents the reactants from reaching the catalysts’ active sites, leading to gas starvation and an immediate drop in cell potential (current) and power [8]. The second factor contributed the decrease performance at high H2 flow rate due to the forced convection effect of H2 at high flow rate. At this condition, the electrolyte membrane could be dehydrated at anode’s electrode surface at high velocity of H2 even the back diffusion of water from cathode to anode may be occurred. Therefore, it would affect the proton transport from anode to cathode as well increase the resistance of cell, and hence decrease the performance of power as shown in Figure 6 and Figure 7 [8]. Furthermore, due to H2 bonding, an average of 1 to 2.5 water molecules are dragged along with each proton as it migrates from the anode to cathode. This is known as electro-osmotic drag. Water will then exits the system with the cathode exhaust as blown-out liquid or vapour. Loss of water can dry out the electrodes or the membrane which lead to a runaway overheating, current loss and even damage to the membrane [13].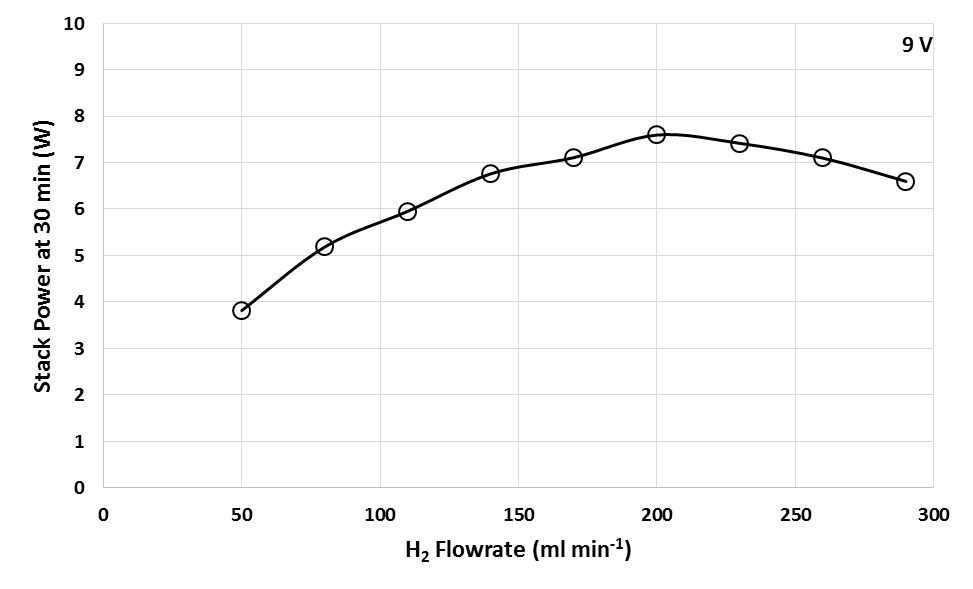 | Figure 7. Power of PEMFC with respect to H2 flowrate at 30 min operation at 9V |
Hence, the water management is of vital importance to achieve maximum performance and durability from PEMFC [8]. On one hand, water is needed to maintain good conductivity and therefore has to be kept in the membrane. On the other hand, too much water in the catalyst layer will reduce the electrochemically active surface area. In addition, it will also hinder the reactant gases to diffuse to the catalyst surface if water present in the pores of the gas diffusion layers. Thus, an optimum H2 flow rate have to be determined to prevent wastage of H2 and flooding in fuel cell [13].
3.3. Effect of CO2 Impurity in Hydrogen Fuel on Stack Performance
Since bio-hydrogen gas produced from biomass consists of mainly CO2 impurity, hence the effect of CO2 on the PEMFC stack was tested by repeating the experiments using different CO2 concentration mixed with fixed H2 concentration before entering the anode side of the fuel cell. The concentrations of CO2 were varied from 0% to 80% in H2 fuel. Figure 8 shows the profiles of the power obtained with current at different CO2 concentration from 0% to 80%. Meanwhile, Figure 9 shows the maximum power obtained from Figure 8 with different CO2 concentrations. For all the cases in Figure 8, the profiles of stack power with current were similar to each other. At the beginning of cell operation, the power increases steadily with current until a maximum power peak was achieved before the power decreased with current. From Figure 9, an equation that relate the relationship between concentration of carbon dioxide in hydrogen fuel, x with power generated, y was generated. The equation obtained which is y =-0.0612x + 9.7853 can be used as a calculation reference to calculate the effect of the concentration of CO2 in H2 fuel on the power generated in fuel cell.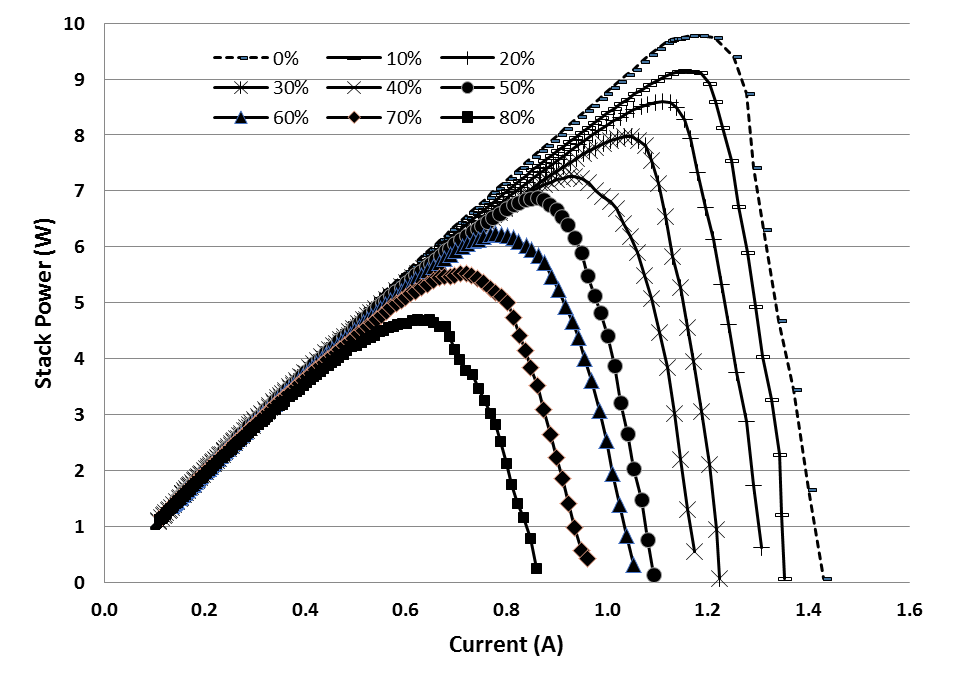 | Figure 8. Profiles of the power obtained with current at different CO2 concentration from 0% to 80% with H2 |
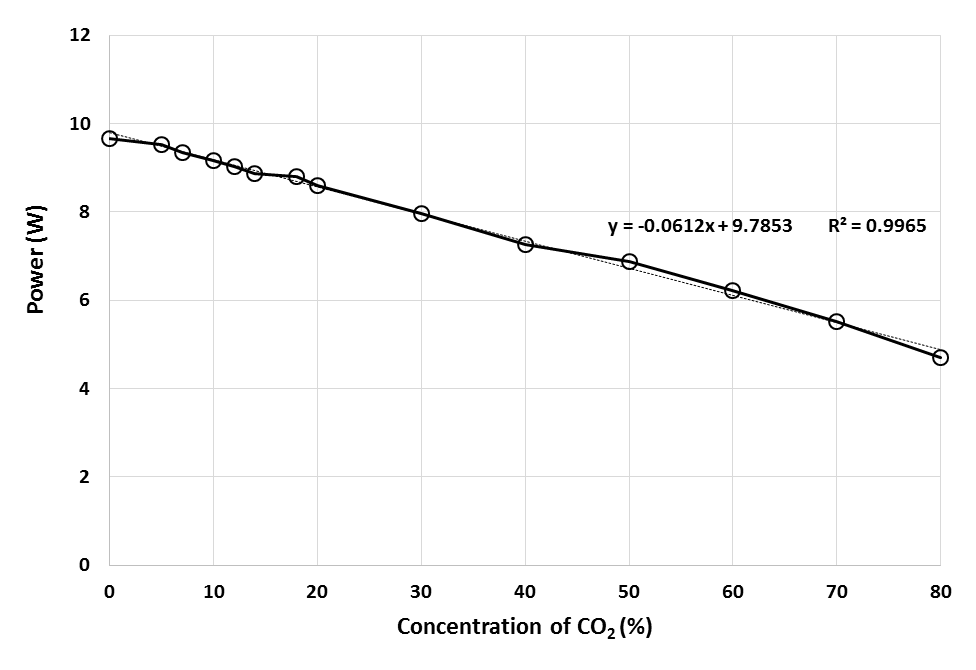 | Figure 9. Maximum power of PEMFC with different CO2 concentration |
Based on the Figures 8 and 9, the drop in the maximum power peak achieved in PEMFC was higher as higher concentration of CO2 was supplied. This can be clearly observed in Figure 9 as the performance decreased linearly with CO2 concentration from 0% to 80%. Based on literature review, although the acidic nature of the membrane electrolyte in PEMFC can tolerate the presence of CO2, this experimental results suggested that CO2 also has significant poisoning effects on cell performance. This poisoning effect by CO2 could be due to the in situ production of CO from CO2 on the active platinum surface and the subsequent adsorption of CO on the active platinum sites through either the reverse water gas shift reaction, RWGSR or the electrochemical reduction of CO2. Thermodynamic calculations reveal that approximately 20-100ppm CO in equilibrium concentration can be produced simply from the RWGSR in the reformate gas with 10-20% CO2. Even at a low CO2 level of 1%, enough CO can be produced to poison more than 50% of the Pt surface sites at normal PEMFC operating conditions, resulting in significant voltage loss [9].
3.4. Effect of CO2 Impurity for Long Term PEMFC Operation
To investigate the effect of CO2 impurity in H2 fuel on stack performance for long-term operation, the PEMFC stack was operated for 2 h using different CO2 concentration. Figure 9 shows the 2 h performance test for PEMFC stack operated at different concentration of CO2.From Figure 10, it was obtained that the presence of CO2 in the anode fuel stream causes a huge decrease in the cell performance compared to pure H2 during 2 h operation. It was also observed that the continuous supply of CO2 in the fuel stream, for prolonged period, caused a decrease in the fuel cell performance. It was found that a higher CO2 concentration resulted decrease in power of stack. Figure 11 shows the power of stack at 2 h operation with different CO2 concentration. From this figure, for 0% to 10% of CO2 concentrations, there are rapid drop in the power generation, while for 20% to 60% CO2 concentration, the drop in power generation decreases. This may be due to most of the part in the PEMFC stack has already been occupied and poisoned by CO2 at 10% CO2 concentration. 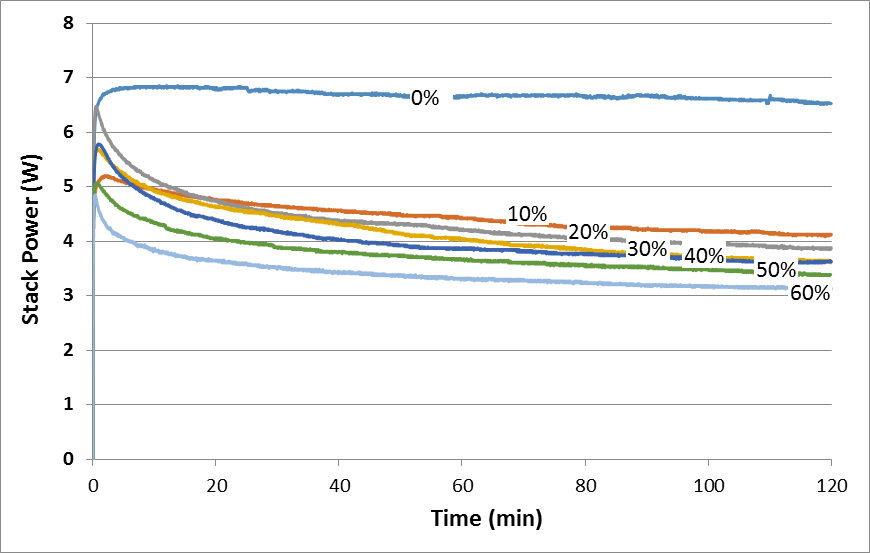 | Figure 10. Performance of PEMFC stack during 2 h operation at different concentration of CO2 |
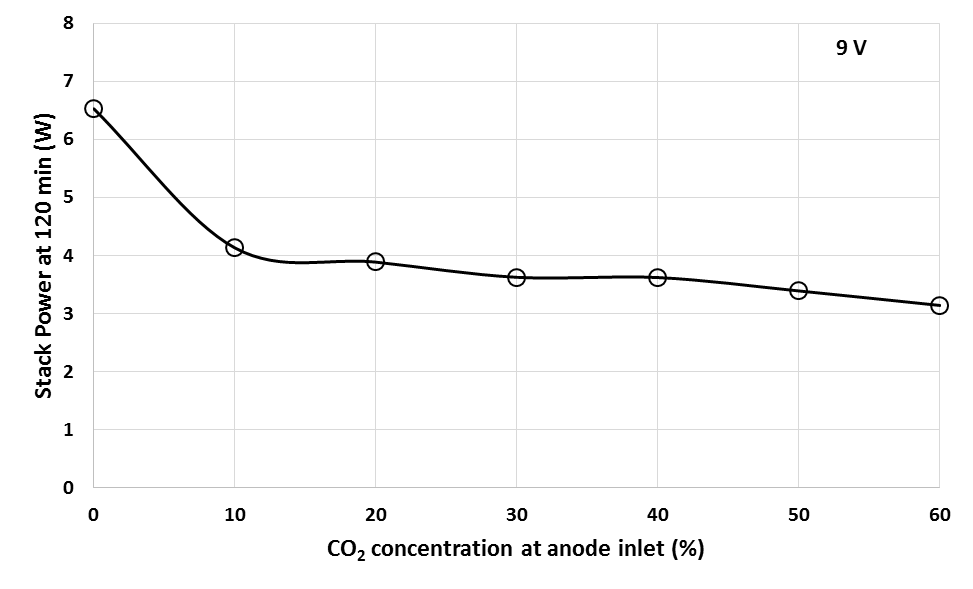 | Figure 11. Performance of PEMFC stack at 2 h operation at different concentration of CO2 |
Based on literature review, several researchers agreed and concluded that CO2 present will decrease the electrochemical catalytic rates, interfere with proton transport across the polymer electrolyte or impede the flow of reactants to or reaction products away from the anode or cathode charge transfer interfaces. Besides, positively charged impurity ions often times have much greater chemical affinity to the ion transport sites within the polymer than protons. The impurity ions also have lower mobility than proton and reduce the ionic conductivity. The presence of impurities also may decrease the operational lifetime of the fuel cell by increasing component failure rate [3]. According to Ahluwalia et al., any CO2 impurity in the fuel adsorbs weakly on the Pt catalyst [11]. At low CO2 concentrations, the observed degradation in cell power can be explained on the basis of CO produced by the reverse water gas shift reaction between CO2 and the adsorbed H2. At higher CO2 concentrations, the decrease in cell potential due to dilution of the H2 also contributes to performances degradation [11]. In short, these results may be useful in developing H2 quality standards in future. Besides that, by supplying pure H2 to the anode, the recovery of the stack performance was obtained in less than half an hour, even after CO2 exposure for 2 hour. This shows that although the amount of CO2 in the anode stream decreases the performance of the fuel cell, it does not leave a permanent poisoning on the catalyst layer and a complete recovery of the system is possible by turning off the CO2. CO2 poisoning can come from 2 sources both of which generate CO, which then poisons the Pt electrocatalyst sites for H2 electrooxidation. The CO sources are the reverse water gas shift reaction, RWGSR (3) and the electrochemical equivalent of RWGSR (4) and (5) as shown below: | (3) |
 | (4) |
 | (5) |
According to Rajalakshmi et al., considering the thermodynamics, at 80°C, 25% CO2 in H2 from the reformate could generate about 100-200 ppm of CO, which also depends on the water concentration. Since the stack was operated at 27°C, and the poisoning effect was reversible and very fast, the RWGSR may not be the mode of poisoning. The performance loss may then be due to the blanket of CO2 covering the reaction sites [10]. Therefore, to achieve high fuel cell performance, high purity of H2 is required.
4. Conclusions
An experimental study on the rate of absorption of CO2 using NaOH has been carried out and it is obtained that the higher concentration of NaOH and the higher CO2 concentration at absoeber inlet resulted the higher amount of CO2 absorbed. Moreover, the absorber function was degraded with time and the degradation increased with the increasing in CO2 concentration at the inlet, while decreased in increasing the NaOH concentration. Effects of H2 flowrate and CO2 concentration on the stack performance were also investigated. It was obtained the stack performance increased with increasing the H2 flowrate. For 10W power generation, it was required to supply a flowrate of H2 at 140 ml min-1 H2 Besides, the relationship between the stack power and H2 flowrate can be obtained by developed equation from experimental data with y=0.0687x in which x represents the H2 flowrate while y represent the maximum power generated. This equation can be used to calculate the H2 flowrate required to generate the desired power using the Horizon PEMFC stack. Meanwhile, study of the concentration of CO2 in the anode stream indicates that the impurity of CO2 is one of the influential factors that cause the degradation in the performance of fuel cell. The higher concentration of CO2 in the anode stream, the larger drop in the maximum power generated in stack. However, at fixed 9V, at CO2 concentration of 1% to 20%, there are rapid drop in the power generation, but from 20% to 60% CO2 concentration, the drop in power generation decreases. This shows that at 20% CO2 concentration, it already occupies and poisons most of the part in the PEMFC stack. In addition, the relationship between the stack power and concentration of CO2 in H2 fuel can be obtained by developed equation from experimental data with y = -0.0612x + 9.7853 in which x represent the concentration of CO2 in H2 fuel while y represent the maximum power generated. Furthermore, recovery of the stack performance was obtained in less than half an hour, even after CO2 exposure for 2 hour. Hence, the effect of CO2 is said to be not permanent, however it could affect the catalyst degradation for a long-term operation.
ACKNOWLEDGEMENTS
This study was partially supported by UKM – YSD Research Project and Dana Universiti Penyelidikan GUP 2014-069 from Universiti Kebangsaan Malaysia.
References
| [1] | Wang X., Baker P., Zhang X., Garces H. F., Bonville L. J., Pasaogullari U. & Molter T. M. 2014. An experimental overview of the effects of hydrogen impurities on polymer electrolyte membrane fuel cell performance. International Journal of Hydrogen Energy 39(0): 19701-19713. |
| [2] | Zhang J. 2008. Hydrogen production by biomass gasification in supercritical water. University of Kentucky, center for applied energy research, Energenia 19(6). |
| [3] | Janssen, G.J.M. and N.P. Lebedeva, Carbon dioxide poisoning on proton-exchange-membrane fuel cell anodes, in Fuel Cells Science and Technology. 2004: Munich, Jerman. |
| [4] | Garzon F. H., Rockward T., Mukundan R., Kienitz B., Chlistunoff J., Brosha E. L. & Sansinena J-M. 2011. Effects of fuel fuel and air impurities on PEM fuel cell performance. FY 2011 Annual Progress Report. |
| [5] | James T. Y. & Pennline H. W. Study of CO2 absorption and desorption in a packed column. National Energy Technology Laborator:.650-654. |
| [6] | Pflug I. J, Angelini P. & Dewey D. H. 1957. Fundamentals of carbon dioxide absorption as they apply to controlled atmosphere storages, Quarterly Bulletin 40 (1): 131-138. |
| [7] | Taymaz I., Akgun F., & Benli M. 2011. Application of response surface methodology to optimize and investigate the effects of operating condition on the performance of DMFC. Energy 36: 1156-1160. |
| [8] | Ji M. & Wei Z. 2009. A Review of water management in polymer electrolyte membrane fuel cells. Energeis 2, 1057-1106. |
| [9] | Li H., Shi Z. & Zhang J. 2009. Impurities in fuels and air. Fuel Cells- Proton Exchange Membrane Fuel Cells (0): 941-950. |
| [10] | Rajalakshmi N., Jayanth T. T. & Dhathathreyan K. S. 2003. Effect of carbon dioxide and ammonia on polymer electrolyte membrane fuel cell stack performance. Fuel Cell 3(4). |
| [11] | Ahluwalia R. K. & Wang X. 2008. Effect of CO and CO2 impurities on performance of direct hydrogen polymer-electrolyte fuel cells. Journal of Power Sources 180(0): 122-131. |
| [12] | Song R. H., Kim C. S. & Shin D. R. 1999. Effect of flow rate and starvation of reactant gases on the performance of phosphoric fuel cells. Journal of Power Sources 86(2000): 289-293. |
| [13] | Strahl S., Husar A. & Riera J. Experimental study of hydrogen purge effects on performance and efficiency of an open-cathode PEM fuel cell system. |
 Abstract
 Reference
 Full-Text PDF
 Full-text HTML