-
Paper Information
- Next Paper
- Previous Paper
- Paper Submission
-
Journal Information
- About This Journal
- Editorial Board
- Current Issue
- Archive
- Author Guidelines
- Contact Us
American Journal of Environmental Engineering
p-ISSN: 2166-4633 e-ISSN: 2166-465X
2015; 5(3A): 33-37
doi:10.5923/c.ajee.201501.06
Kinetics of Methylene Blue Adsorption on Sulphuric Acid Treated Coconut (Cocos nucifiera) Frond Powder
Mardhiah Ismail, Megat Ahmad Kamal Megat Hanafiah, Mohamad Shahrizad Zainal Abidin, Zurhana Mat Hussin, Khadijah Khalid
Faculty of Applied Sciences, Universiti Teknologi MARA (Universiti Teknologi MARA Pahang)
Correspondence to: Zurhana Mat Hussin, Faculty of Applied Sciences, Universiti Teknologi MARA (Universiti Teknologi MARA Pahang).
| Email: |  |
Copyright © 2015 Scientific & Academic Publishing. All Rights Reserved.
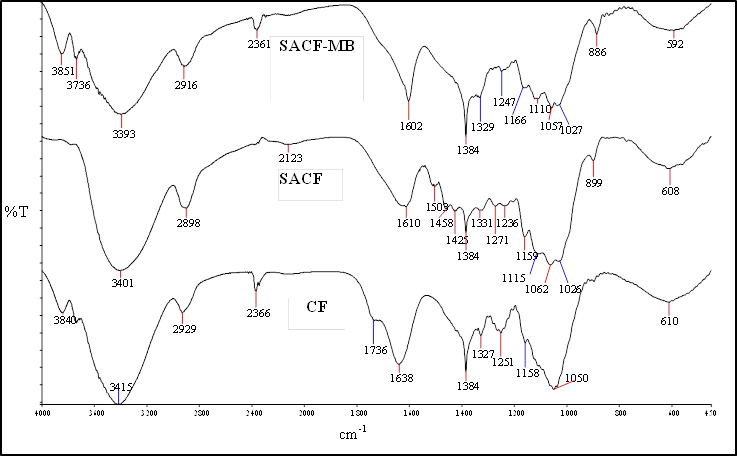
In this study, coconut frond treated with sulphuric acid (SACF) was used as a low-cost adsorbent in removing methylene blue (MB) from aqueous solutions. The kinetics of methylene blue (MB) adsorption onto SACF was described by applying the pseudo-first-order and pseudo-second-order kinetic model with the latter better fitted kinetics data. FTIR analysis showed that carbonyl and hydroxyl groups were involved in the uptake of MB. Mechanisms of MB adsorption were identified as ion-exchange and complexation.
Keywords: Adsorption, Coconut frond, Kinetics, Sulphuric acid
Cite this paper: Mardhiah Ismail, Megat Ahmad Kamal Megat Hanafiah, Mohamad Shahrizad Zainal Abidin, Zurhana Mat Hussin, Khadijah Khalid, Kinetics of Methylene Blue Adsorption on Sulphuric Acid Treated Coconut (Cocos nucifiera) Frond Powder, American Journal of Environmental Engineering, Vol. 5 No. 3A, 2015, pp. 33-37. doi: 10.5923/c.ajee.201501.06.
Article Outline
1. Introduction
- Dyes are widely used in industries such as printing, textiles, plastic and cosmetic. The breakdown products of dyes may be toxic for living organisms [1]. Hence, the removal of dyes is essential before the dyes are discharged into water bodies. Removal of dyes from effluents is quite challenging due to the nature of dyes that do not degrade easily. It is also generally difficult to remove completely from wastewater by conventional wastewater treatment systems [2]. Dye removal is widely practiced by implementing physicochemical methods such as coagulation, ultrafiltration, electrochemical, and photo-oxidant [3]. One of the commonly used dyes by industries is methylene blue (MB), a heterocyclic compound with the chemical formula of C16H18ClNS.3H2O as shown in Figure 1.
 | Figure 1. Structure of MB |
2. Experimental
2.1. Adsorbent Preparation and Characterization
- CF was obtained from Jengka, Malaysia. The frond was rinsed with water to remove dirt or impurities, and then it was rinsed with distilled water before drying in an oven at 80 ˚C overnight. CF was cut into small pieces, ground and sieved to a constant size of 125μm – 250 μm. The CF powder was washed extensively with distilled water until the washing was free from colour pigments before it was dried at 110˚C overnight. A volume of 450 mL (0.50 M) H2SO4 was heated to 110 ˚C and 20 g CF powder was added into the solution and heated again at 110 ˚C for 180 min. The sample was allowed to cool at room temperature before it was rinsed with distilled water. Then, the sample was soaked in 500 mL Na2CO3 solution overnight before being filtered and dried in an oven at 80 ˚C overnight [14]. The sample was placed in a plastic container for further used and abbreviated as SACF. The types of functional groups present in the CF and SACF were determined by using a Fourier transform infrared spectrometer (FTIR) (PerkinElmer, Spectrum 100, USA). The field emission scanning electron microscope (FESEM, JEOL, JSM7800F, Japan) coupled with energy dispersive X-ray (EDX, Microanalysis, Oxford instrument, UK) was performed to analyse the surface morphology of SACF. The percentage by mass of the element contained in the SACF was determined by using a CHNS analyser (Vario Macro CHNS, Elementar, Germany). The amount of MB adsorbed (qe, mg g-1) and removed (%) was calculated by using equations (1) and (2), respectively:
 | (1) |
 | (2) |
2.2. Adsorption Experiments
- Methylene blue was purchased from QRec, Malaysia. A stock solution of 1000 mg L-1 MB was initially prepared before being diluted to the desired concentrations with deionized water. The adsorption experiments were performed by mixing 0.0100 g SACF with 50 mL (20 mg L-1) MB solutions and stirred at 120 stroke per min at 298 ± 1 K for 300 min (equilibrium time). The initial pH of the MB solution was adjusted to 6 by addition of drops of 0.10 M NaOH or HCl solutions. Adsorption kinetics study was conducted using three different MB concentrations (20, 30 and 40 mg L-1) at different contact times (0-300 min). After adsorption, the SACF was separated from the solution by using a centrifuge (Hermle Labortechnik Z206, Germany) at 6,000 rpm for 15 min. The final concentration of MB was determined by using a UV-Visible spectrophotometer (UV 1800, Shimadzu Corporation, Japan) at λmax 665 nm.
3. Results and Discussion
3.1. Adsorbent Characterization
- The result for CHNOS analysis is given in Table 1. SACF showed an increased percentage of carbon, nitrogen and sulphur compared with raw CF. The increase of S value could come from H2SO4 treatment that introduced more S atoms on coconut frond powder surface.
|
 | Figure 2. FTIR spectra of CF, SACF before and after MB adsorption |
 | Figure 3. SEM images CF (a), SACF (b) and SACF loaded with MB (c) |
 | Figure 4. EDX spectrum of CF (a), SACF (b) and SACF-MB loaded (c) |
3.2. Effect of pH
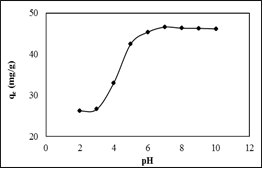
- As shown in Figure 5, a sharp increase in the amount of MB adsorbed was observed from pH 3 to 5. At pH 3, carboxylic group would be deprotonated, exposing more negative charges and more cationic MB could be attracted. Above pH 6, the amount of MB adsorbed remained constant and this finding support by finding by [4] [14]. The lowest amount of MB adsorbed at pH 2 – 3 was due to the competition of cationic MB with H+ ions in an acidic solution.
 | Figure 5. Effect of pH on the adsorption of MB onto SACF |
3.3. Effect of Initial MB Concentration and Contact Time
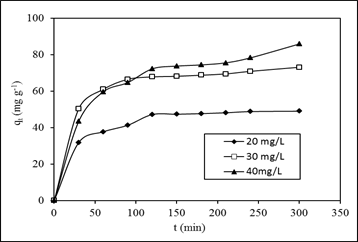
- Fig. 6 shows the adsorption equilibrium time was reached in 100, 150 and 200 min for MB concentrations of 20, 30, and 40 mg L-1, respectively. However, experiments were continued until 300 min to ensure equilibrium was completely achieved. The amount adsorbed increased from 47.15 to 85.33 mg g-1 when the concentrations of MB were increased from 20 to 40 mg L-1. The maximum dye uptakes were 48.99, 73.08 and 85.83 mg g-1 for MB concentrations of 20, 30 and 40 mg L-1 respectively. The curves suggested that the adsorption process involved three main phases, which consist of rapid phase, slow phase and dynamic equilibrium phase. The rapid phase occurred in the first 40 min, which was related to the external surface adsorption of MB. It was followed by the slow adsorption rate within the range of 60 – 120 min. The equilibrium was reached at the last phase which is also known as dynamic equilibrium time. This process occurs when there is no more available external site, and this will lead to the diffusion into the porous structure of an adsorbent [11]. A higher amount of MB adsorbed can be explained in term of increasing mass transfer, leading to a greater interaction between MB and SACF. More adsorption sites will be covered as more adsorbates are attached to an adsorbent surface [3].
 | Figure 6. Effect of initial MB concentration and contact time of MB adsorption by SACF |
3.4. Adsorption Kinetic
- Adsorption kinetic for the adsorption of MB onto SACF was explored by applying pseudo-first-order [12] and pseudo-second-order [13] models. The models are expressed by equations (3) and (4), respectively.
 | (3) |
 | (4) |
|
4. Conclusions
- Sulphuric acid (H2SO4) modification can be applied to produce a biosorbent with a relatively fast uptake of MB. Based on the characterization study, a large number of carbonyl and hydroxyl groups were present on the surface of SACP. SEM images and EDX spectra of adsorbent surface, before and after adsorption showed that the adsorbent has lack of porosity and ion-exchange could be involved in the MB adsorption process. This work suggests the potential use of SACF for removal of MB from industrial wastewater.
ACKNOWLEDGEMENTS
- This work was financially supported by the Excellence Fund (DANA KCM, vote no. 011000120007), UiTM Pahang.
 Abstract
 Reference
 Full-Text PDF
 Full-text HTML
