-
Paper Information
- Next Paper
- Paper Submission
-
Journal Information
- About This Journal
- Editorial Board
- Current Issue
- Archive
- Author Guidelines
- Contact Us
American Journal of Environmental Engineering
p-ISSN: 2166-4633 e-ISSN: 2166-465X
2015; 5(3A): 1-7
doi:10.5923/c.ajee.201501.01
Metal Pollution and Ecological Risk Assessment of Balok River Sediment, Pahang Malaysia
 Abstract
 Reference
 Full-Text PDF
 Full-text HTML
Mohd Zahari Abdullah, Veronica Cyrila Louis, Mohd Tahir Abas
Faculty of Applied Sciences, Universiti Teknologi MARA Pahang
Correspondence to: Mohd Zahari Abdullah, Faculty of Applied Sciences, Universiti Teknologi MARA Pahang.
| Email: |  |
Copyright © 2015 Scientific & Academic Publishing. All Rights Reserved.
The water quality of the Balok River is believed has been deteriorated by anthropogenic impact as a result of the industrial activities in Gebeng Industrial area. This study was conducted to assess the pollution level of the river based on the metal concentrations deposited in the surface river sediment and aslo to evaluate the harm of the studied metals to the water body. The samples of surface river sediment were collected at ten sampling stations that evenly distributed along the river. The sampling technique and sample treatment were done based on the standard procedures as generally applied by other researchers. The total content of Cd, Cr, Cu, Mn, Ni, Pb, and Zn were analyzed by using ICP-OES after an acid extraction with microwave digester. Their mean concentrations (mg/kg) of the respective studied elements are 0.5, 41.9, 24.2, 155.7, 17.3 30.3 and 152.1. Four pollution indices were used to assess the quality of the river including the contamination factor (CF), enrichment factor (EF), pollution load index (PLI) and potential ecological risk index method (PERI). The enrichment level of the studied metals were found in decreasing order as Pb > Zn > Ni > Cr > Cd > Mn > Cu. The potential ecological risk indices of the metals to the water body of the river were observed as Cd > Pb > Cu > Cr > Zn. The results of the pollution indexes confirmed that the surface sediment of the river was moderately polluted with the studied metals and Cd is the only metal that potentially to pose the ecological risk to the water body of the studied river.
Keywords: Water quality,River sediment, Heavy metals, Contamination factor, Enrichment factor
Cite this paper: Mohd Zahari Abdullah, Veronica Cyrila Louis, Mohd Tahir Abas, Metal Pollution and Ecological Risk Assessment of Balok River Sediment, Pahang Malaysia, American Journal of Environmental Engineering, Vol. 5 No. 3A, 2015, pp. 1-7. doi: 10.5923/c.ajee.201501.01.
Article Outline
1. Introduction
- Heavy metals existed in the environment through natural process and human activities. The variation of natural sources such as acidification, erosion and weathering process are common ways of heavy metals brought into the environment [1]. Human activities such as industrial processes, domestic wastes, agricultural activities and emissions from vehicles and factory plants are the main sources of some heavy metals enters and deposited into the environment [2]. These activities continuously accumulated and increased the metal particles in the various environmental systems. All of these anthropogenic sources contribute the negative impact to the surroundings. Sediment plays a major role in determining the pollution pattern of marine ecosystem [3]. It can act as both the carriers and sinks for contaminants that bring out the information of the history of pollution of the river and also contribute a record of catchment inputs into the aquatic ecosystem [4]. Any information regarding the impact of human activities and natural processes can be identified by analyzing the sediments [5].Gebeng area in Pahang Malaysia, is surrounded by a large number of industries that actively operated in various types of manufacturing process such as metal work factories, steel industries, petrochemicals, chemicals, palm oil mills, polymer, energy, oil and gas industries, coal mining, concrete industries, concrete ducting, pipe coating facility, wood processing, detergent and air product. The industrial activities most probably, directly or indirectly, could introduce some contaminants into the adjacent river. A recent study done by Sobahan et al. [6] confirmed that the river surface water has been polluted with some metals including Pb, Co, Cu, Cd and As at a certain levels. Another research done by Hossain et al. [7] and Kodori [8] reported that the present of several heavy metals such as Cr, Cd, Ni, Zn and Hg in the surface river water can be related directly to the wastewater discharged by the industries that scattered in Gebeng area. Inappropriate disposal of the industrial wastes and effluents will reduce the surface water quality and will greatly influence the problem of water resources quality. Heavy metals are known for its hazards that could cause fatal to human health and environment. The toxicity of Zn, Cu and Cd could cause the alteration in human central nervous system and respiratory system [9]. These metals also have the ability to cause disruptions in endocrine system. The utmost fatal heavy metals are arsenic, mercury, copper, lead and cadmium [10]. These metals are hazardous to human health even in very low concentrations due to its high in toxicity and non-degradable properties. There are several human diseases such as development retardation or malformation, kidney damage, cancer and abortion has been linked with the exposure to heavy metals. In some cases, exposure to very high concentration of heavy metal caused death [11]. Despite the existence of this river is considered very important for the local residents but the data related to ecological risk index for the river is still lacking and get less attention from the local authorities local researchers. Hence, this study was conducted to evaluate the quality of the river based on contamination factor, enrichment factor and pollution load index of the selected heavy metals and to assess the potential ecological risk indices of the river.
2. Methodology
2.1. Sampling Area
- The sediment samples were collected at ten sampling stations along the Balok River which located close to the Gebeng industrial site and commercial beach area in Kuantan, eastern part of the Peninsular Malaysia. Figure 1 shows the arrangement of the sampling stations along the Balok River. The river flows pass through the wide industrial facilities which include steel industries, palm oil mills and pipe coating and others. The Global positioning System (GPS) was used to ensure the points are coincided with coordinate marked for of each sampling point.
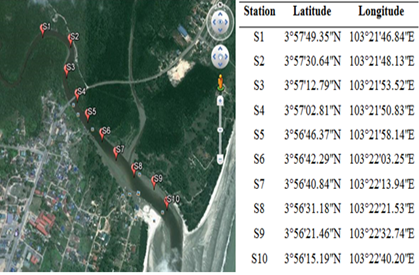 | Figure 1. The figure shows the ten selected sampling stations and its particular coordinates along the Balok River stream (Source: Google Map) |
2.2. Sample Collection
- The Ponar Type grad sampler was used to collect river sediment at 20 cm deep. The sediment samples were then kept in a cleaned polyvinyl plastic container to avoid any contamination and transported to the laboratory for further treatment and analysis. Ten samples were collected along 5 km distance of the river stream and 500 m away between the two consecutive sampling points. Sediment samples were also collected at Janda Baik in Bentong Pahang to be a control sample.
2.3. Sample Treatment
- All samples were air dried for fourteen days and were then oven dried at 100°C for 24 hours before being grounded into fine particles using pastel and mortar and were sieved for 2 mm mesh [12]. A mixture of 5 ml of 65% HNO3, 15 ml of 37% HCl and 2 ml of 35% H2O2 were used to digest 0.5 g of the fine samples. Milestone Ethos 1 microwave oven was operated at 165°C for the first 10 minutes and then raised to 175°C for 13 minutes with the maximum power of 1200 W [13]. The sample blank were prepared using the same procedure but with the absence of the sediment samples. For each sample, a total of three replicates were prepared. The concentrations of the selected metals were measured using Perkin Elmer Optima 5300DV ICP-OES. For quality assurance and quality control, all of the glassware were soaked in 10% HNO3 for 24 hours and rinsed using double distilled water. All data were treated for contamination factor, enrichment factors, geo-accumulation index and Potential Ecological Risk Index to assess the quality of the river.The quality control of the analytical procedure was carried out by analyzing the standard reference material SRM-CC141. The SRM was analyzed (in triplicate) with the same way as treated to the actual samples. The results showed that all the elements could be analyzed with 80 to 121 % recoveries which were considered as within an acceptable level [14].
2.4. Assessment of the Metal Contamination
- To evaluate the level of metal contamination of the sediment samples, four parameters were used including Enrichment Factor (EF), Contamination Factor (CF), pollution load index (PLI) and potential ecological risk index (PERI).
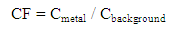
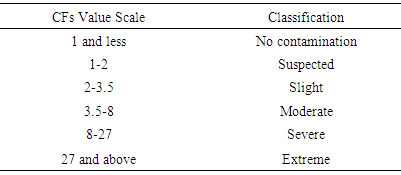
2.4.1. Contamination Factor (CF)
- The parameter of CF was determined to express the level of metal contamination in surface sediment. The contaminant factor was calculated using the following formula:
 | (1) |
|
 | (2) |
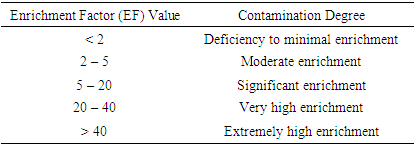
2.4.2. Enrichment Factor (EF)
- The enrichment factor was calculated using the following equation [18]:
 | (3) |
|
2.4.3. Potential Ecological Risk Index Method (PERI)
- Potential ecological risk index method, PERI was used to evaluate the harm of heavy metals in the sediment samples. PERI was calculated by using the following formula [20]:
 | (4) |
 is the potential ecological risk index for single heavy metal pollution and can be calculated as:
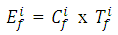 | (5) |
 is the response coefficient for the toxicity of the single metal.
  is the pollution index and can was defined as
 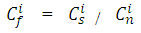 | (6) |
 is the concentration of heavy metal in the sediment and
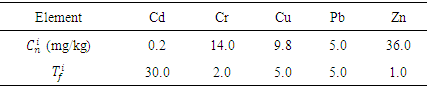
  is the reference value which is the concentration of heavy metal in the controlled sample. Table 3 shows the concentration of heavy metal in the controlled sample,
  and the response coefficient for the toxicity of single metal,
  .
.
|
 and RI, the grading standards of potential ecological risk of the selected heavy metals can be obtained. Table 4 shows the value range for the potential ecological risk index and the potential toxicity index along with the ecological risk level.
|
 and pollution levels. [21]
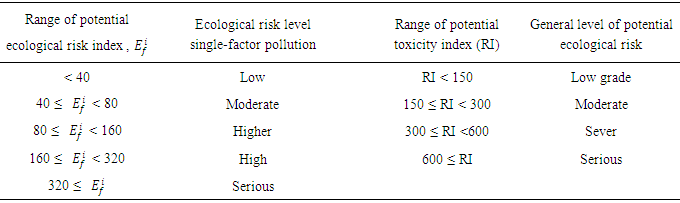
3. Results and Discussion
3.1. Heavy Metal Concentrations
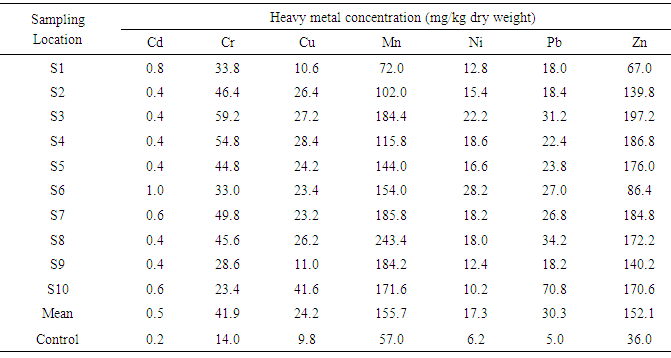
- The total metal concentrations observed at each sampling site in this study are shown in Table 5. The metal contents were ranging over the following concentration: Cd: 0.4 – 1.0 mg/kg; Cr: 23.4 – 59.2 mg/kg; Cu: 10.6 – 41.6 mg/kg; Mn: 72.0 – 243.4 mg/kg; Ni: 10.2 – 28.2 mg/kg; Pb: 18.0 – 34.2 mg/kg; Zn: 67.0 – 197.2 mg/kg dry weight. Based on the mean values, the metals follow the decreasing concentration in the order of Mn > Zn > Cr > Pb > Cu > Ni > Cd. The data shows that Mn and Zn are the dominant metals found in the surface sediment from the study area. Cr, Pb and Cu were measured at lower levels compared to Mn and Zn, whereas Ni indicates a substantial level in concentration while Cd gives the lowest mean concentration in the sediment samples.
|
3.2. Estimating Metals Pollution Impact
3.2.1. Enrichment Factor Analysis
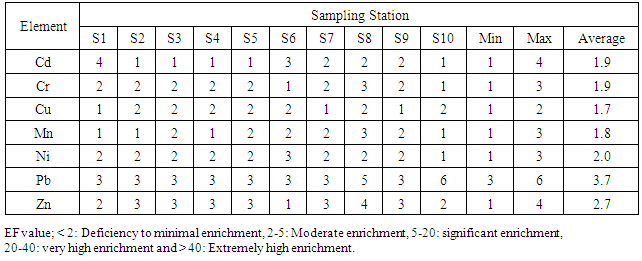
- The enrichment factor (EF) data has been used to evaluate the geochemical trends between areas in this study. The technique was considered among the best analytical method that can be used to predict the origin of the heavy metals which dispersed in environmental system [22]. The background concentrations of the studied metals were obtained based on the study done by Ozkan [23]. The EF values for the studied metals obtained in this study are listed in Table 6.
|
3.2.2. Pollution Load Index, PLI
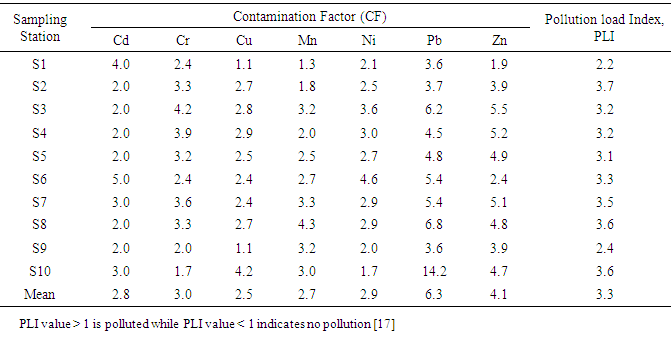
- The PLI represents the number of times by which the metal content in the sediment exceeds the background concentration and gives a summative indication for the overall levels of heavy metal toxicity in a particular sample [25]. As indication, the PLI value higher than 1 indicating polluted while lower than 1 indicating no pollution. Table 7 summarized the PLI values observed in Balok River sediments.
|
|
3.2.3. Potential Ecological Risk Index Method (PERI)
- In order to evaluate the harm of the studied heavy metals in the sediments to the water body, potential ecological risk index method (PERI) was applied. The potential ecological risk indices (
 ) and potential toxicity response indices (RI) of heavy metals in the sediments along Balok River sampling site were listed in Table 9.
|
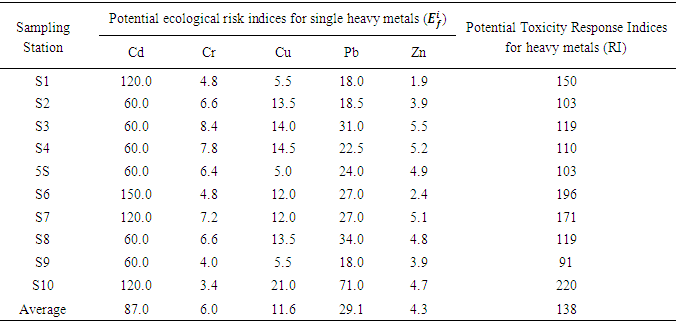
 as 87. Four stations, S1, S6, S7 and S10 were contributed higher values of ecological risk indices,
  with 120, 150, 120 and 120 for the respective sampling stations.The other sampling stations have posed the moderate ecological risk to the river water with the PERI values below 40. The high contents of Cd in surface sediment sample observed in this study can be attributed to the geological factor, fishing activities and sewage discharge [27]. The studies done by Ntakirutimana et al. [28] and Zhu et al [29] have obtained almost the same observations. For Pb, only sampling station S10 was identified could pose a moderate ecological risk with the
  value 71 and showed slight potential ecological risk for the other stations. In general, the potential ecological risk indices were observed in the declining order as Cd > Pb > Cu > Cr > Zn. However, the results obtained in this study just reflected the accumulation of heavy metals in the recent years (early 1970’s) because the sediment samples were collected only at 20 cm in depth [30]. The highest the RI value with 220 was recorded at station S10, and the lowest was recorded in station S9 with the value as 91. The average RI values of the 10 sampling stations were 138. According to the evaluating standard, in general, the sediment samples of the river in this study were in low ecological risk level (RI ≤ 150) except for S6 and S10 which were in moderate potential ecological risk levels with 150 ≤ RI < 150 (Table 4).
4. Conclusions
- All the studied metals Cd, Cu, Cr, Pb, Zn, Ni and Mn in sediments from the 10 sampling stations along the Balok River reflected a low ecological risk to the water body except for cadmium, Cd which posed a moderate to higher ecological risk at all stations. Pb was also posed a moderate ecological risk to the water body at S10 which could be related to the fishing industry which located adjacent to S10. The analysis of the sediment samples collected from 10 locations showed that the Balok River has been slightly and moderately contaminated by the studied metals and the existence of these metals can be attributed to human activities for the local residents. The results of the study indirectly indicate the potential contribution of the metals through industrial waste discharges.
ACKNOWLEDGEMENTS
- The authors would like to thank to the Malaysian Ministry of Higher Education for the financial supports (ERGS grant 011000120028) and also thank to UiTM Pahang for providing all kinds of material supports for the successfulness of the study.